Enterprise software used for data lineage & Relation visualization

Enterprise software used for data lineage & Relation visualization

Enterprise software used for data lineage & Relation visualization

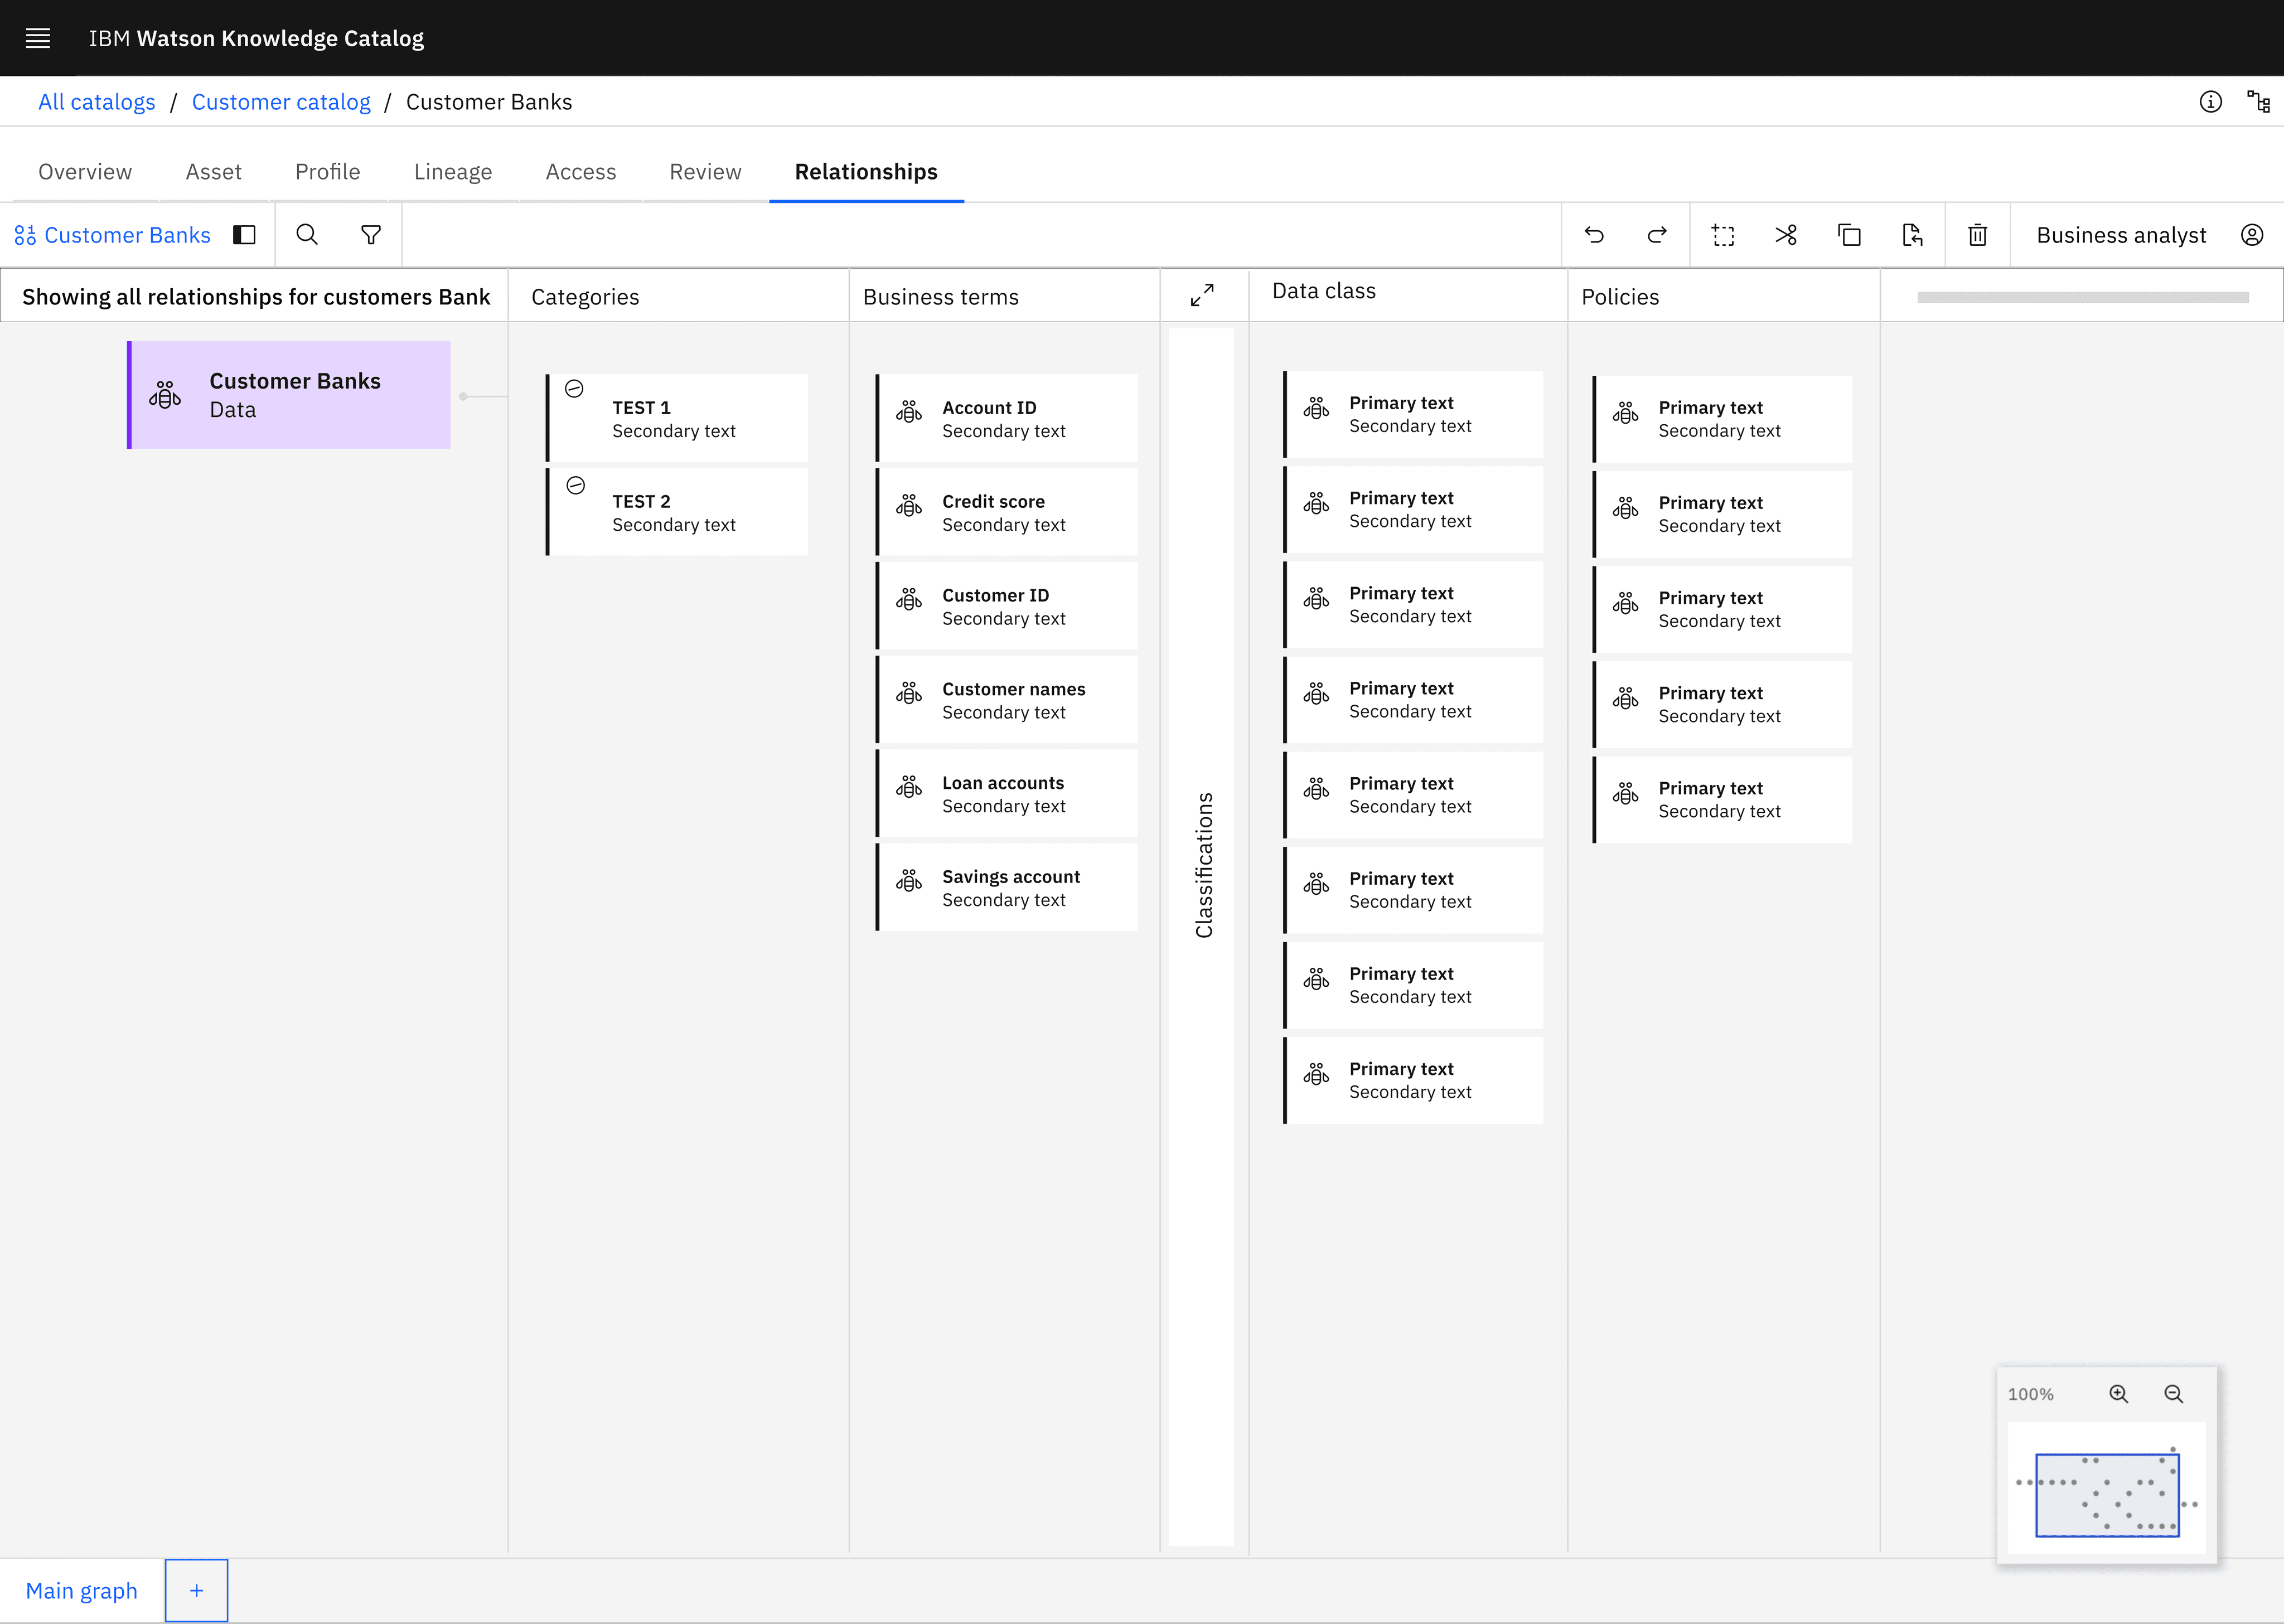
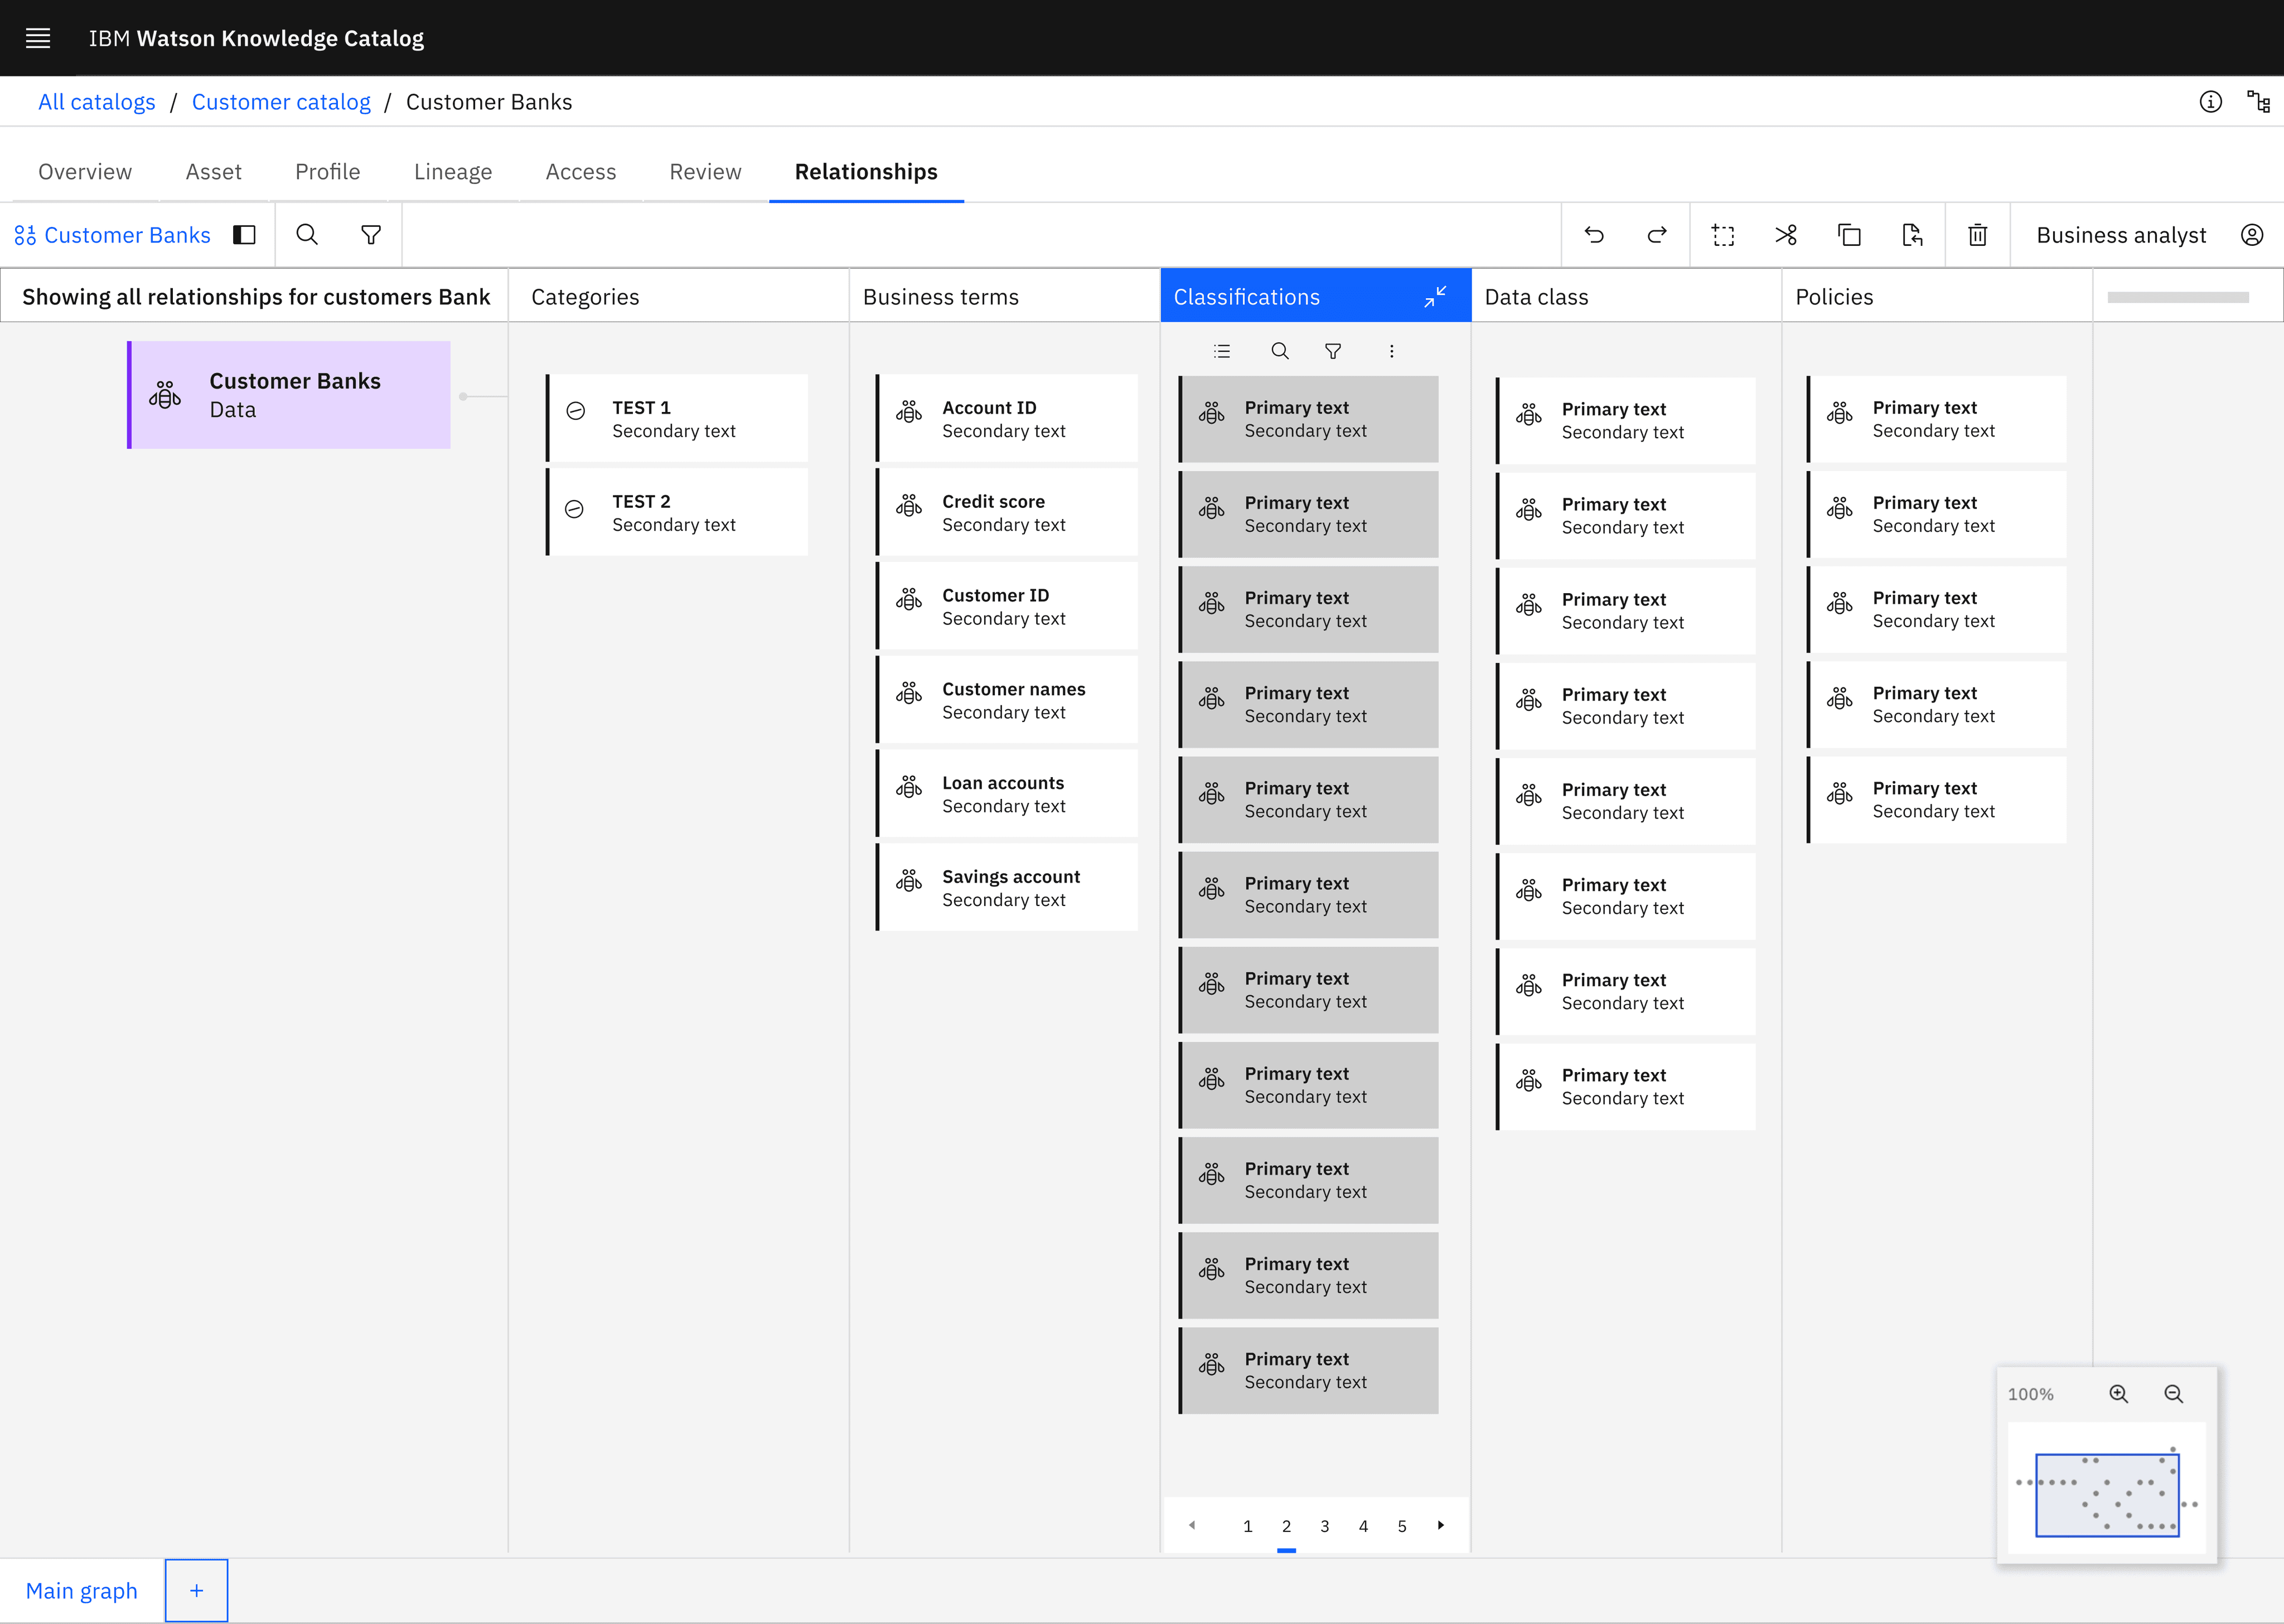
As a UX and Visual Design intern at IBM in 2023, I with my team led the creation of Relationship Explorer, a data visualization tool mapping connections between governance artifacts (data rules and categories) and catalog assets (data items).Tailored for tech experts handling complex data, this tool streamlines the process of locating governance assignments and ensuring compliance, with applications across fields like medicine, manufacturing, banking, and tech.

I contributed to ideating key features and interaction designs in the initial stages, laying a strong foundation for the product’s final interface, now live and in use on IBM’s platform.

Enterprise software

Internship

Internship

Internship

Enterprise software

Enterprise software

UX design

UX Design

UX

Data visualization

Data visualization

Data visualization

Live project

Live project

Live project

Copyright @IBM Corporation 1994, 2024

Copyright @IBM Corporation 1994, 2024

Copyright @IBM Corporation 1994, 2024

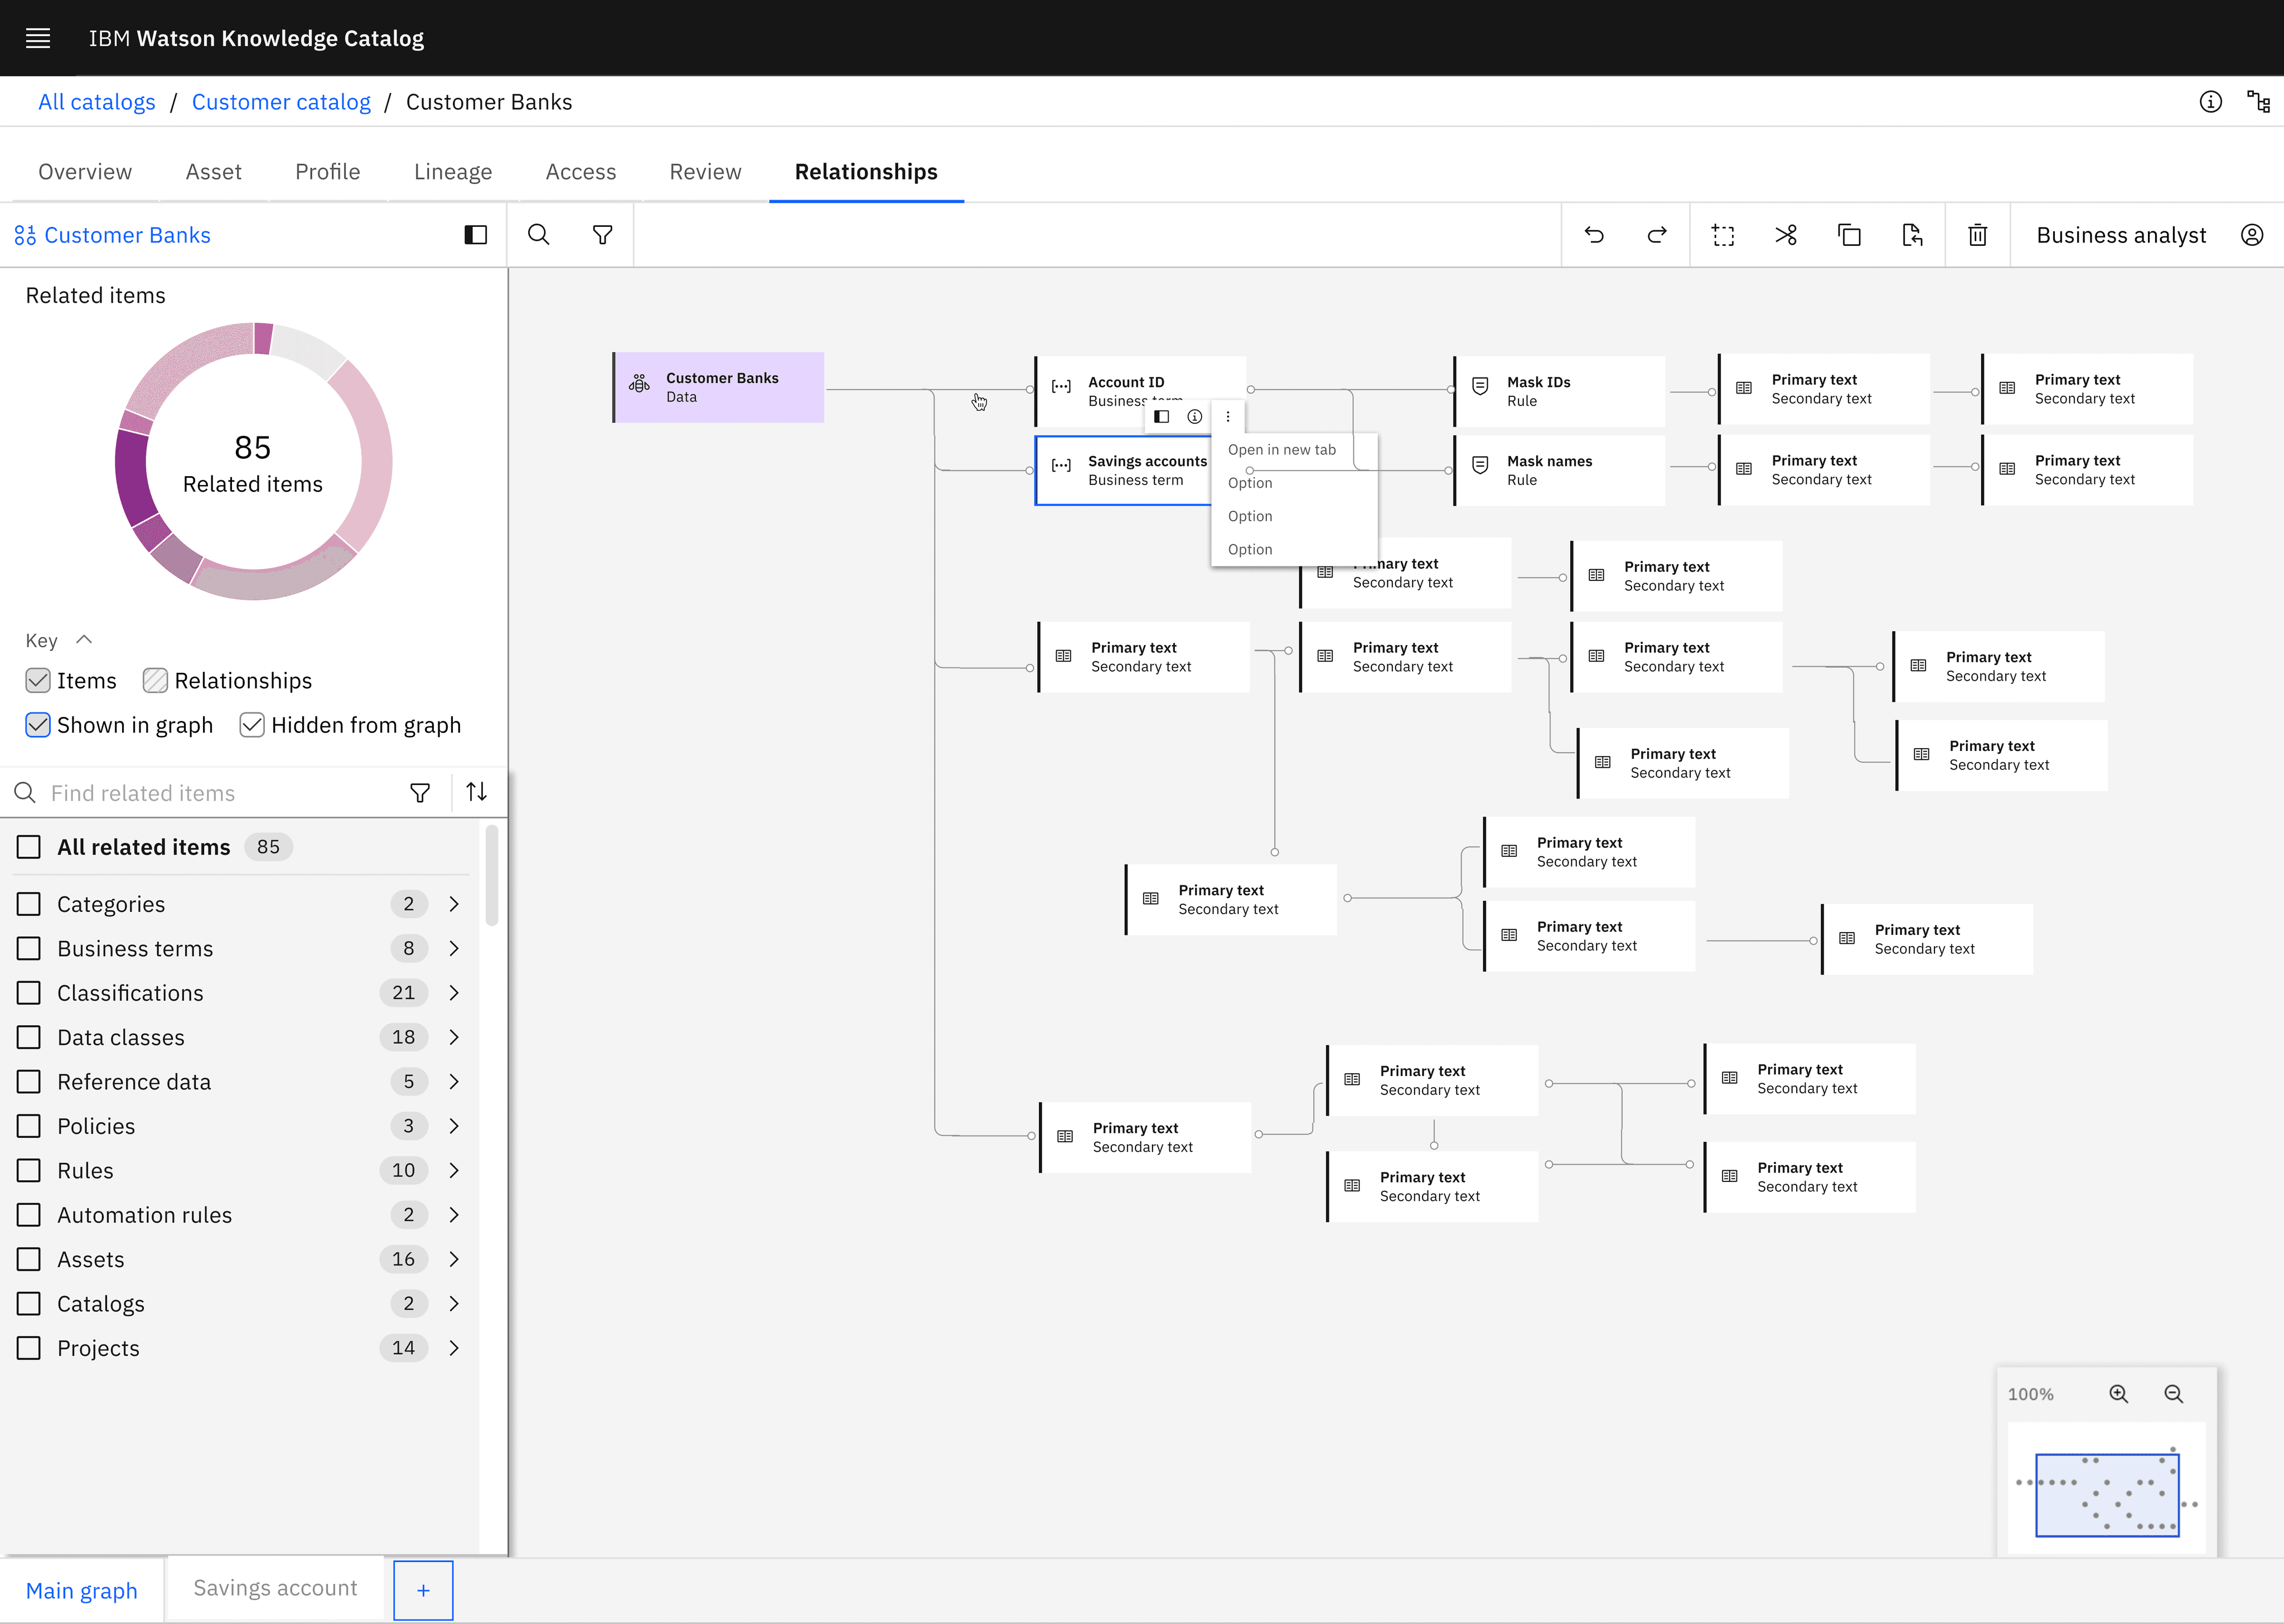
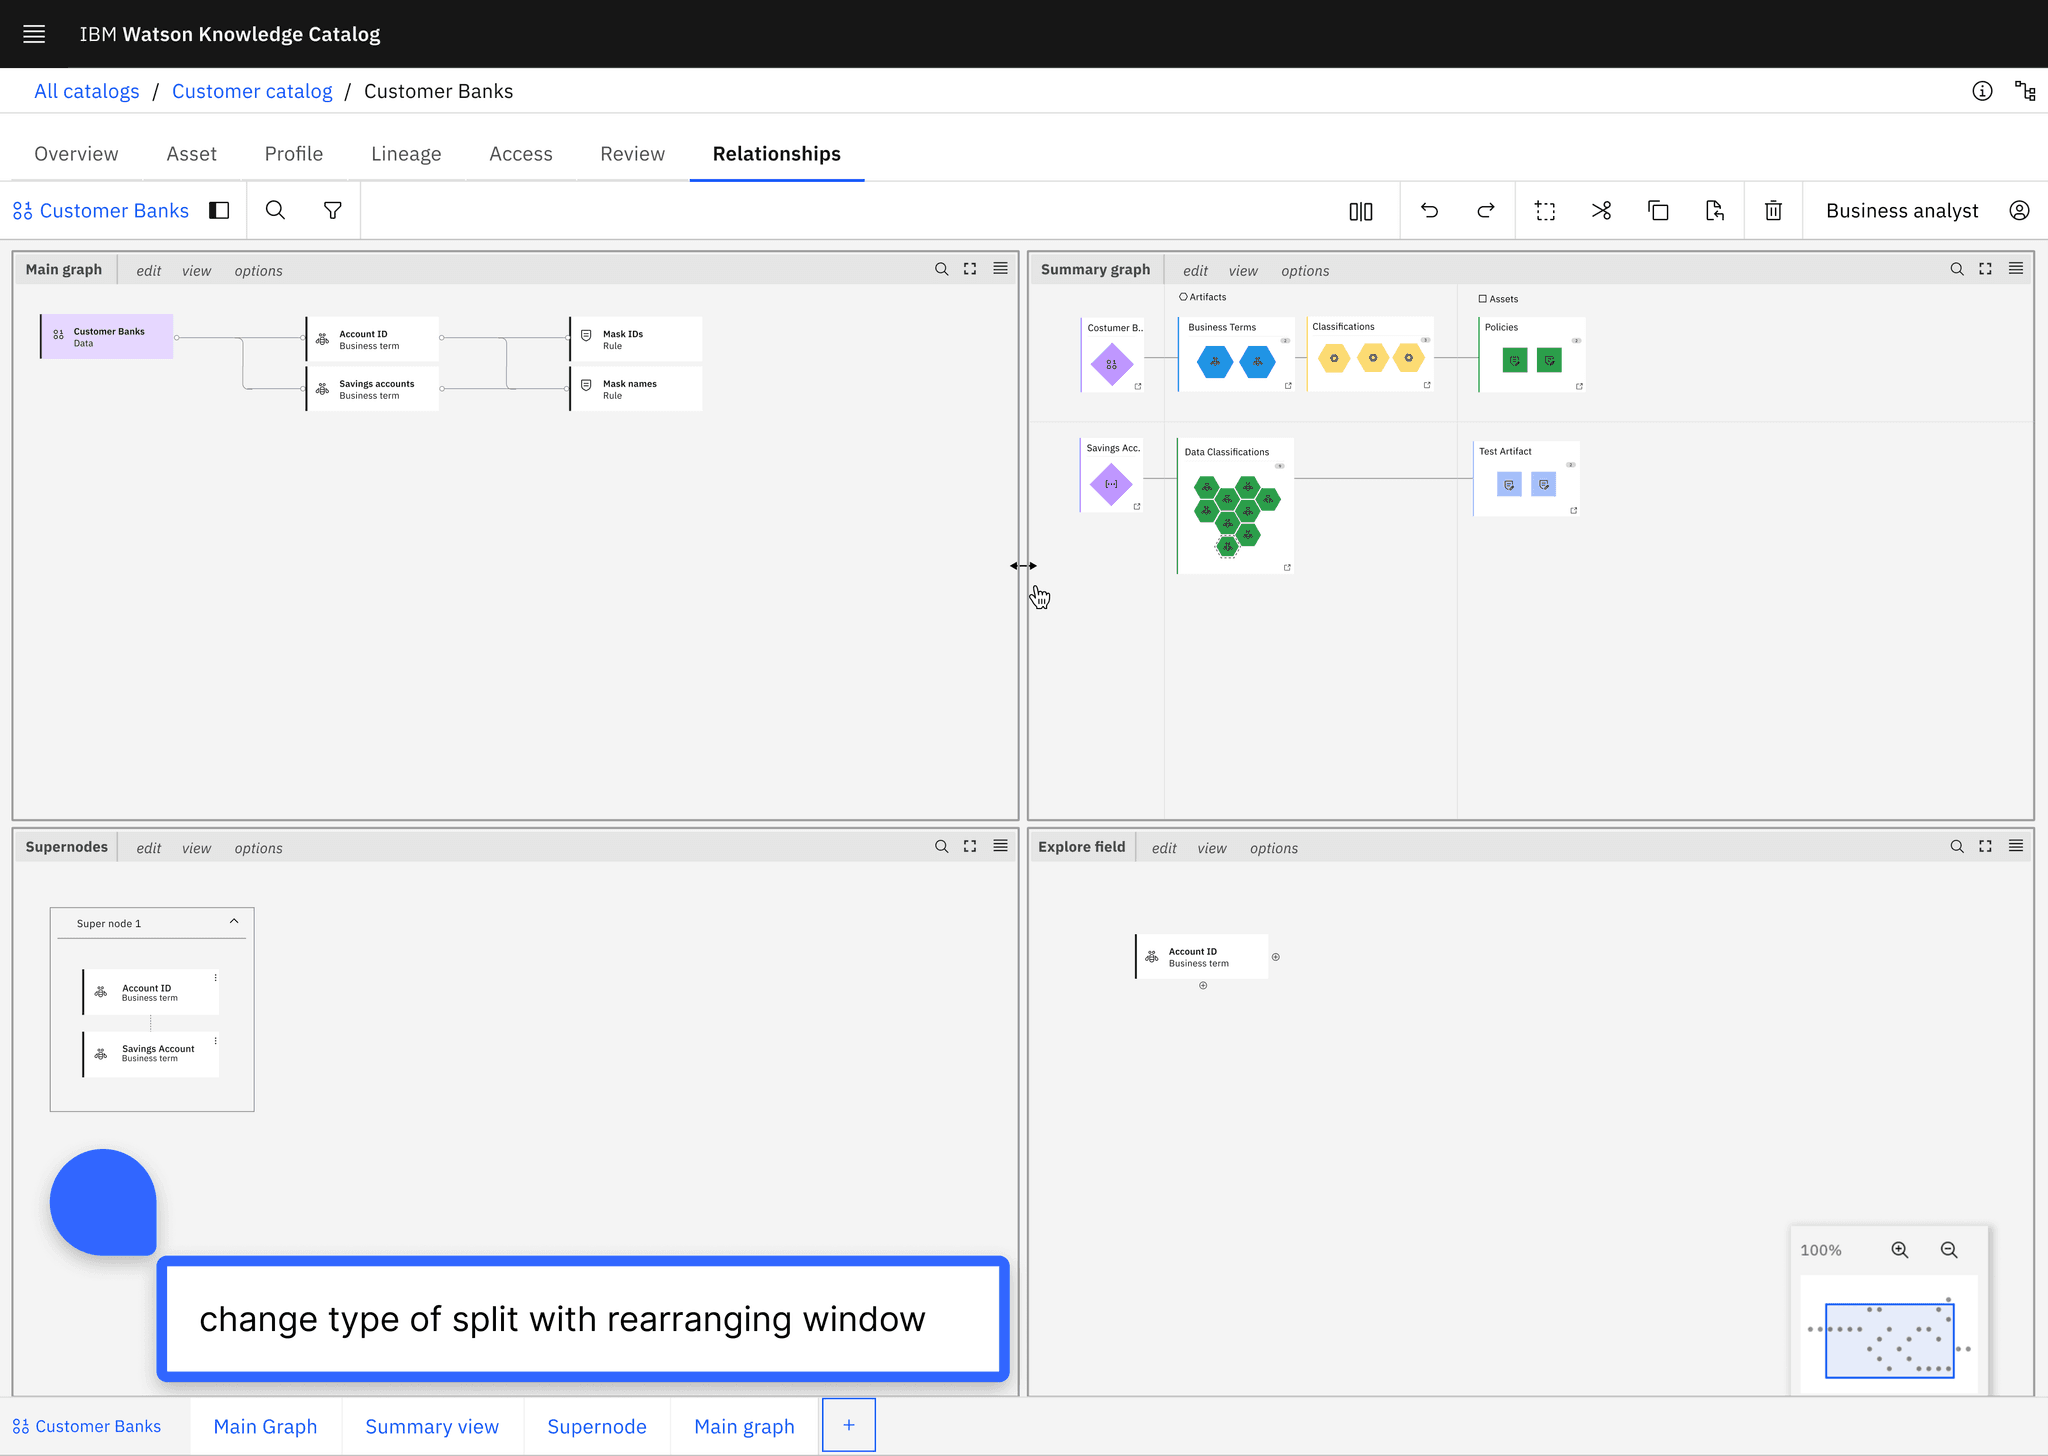
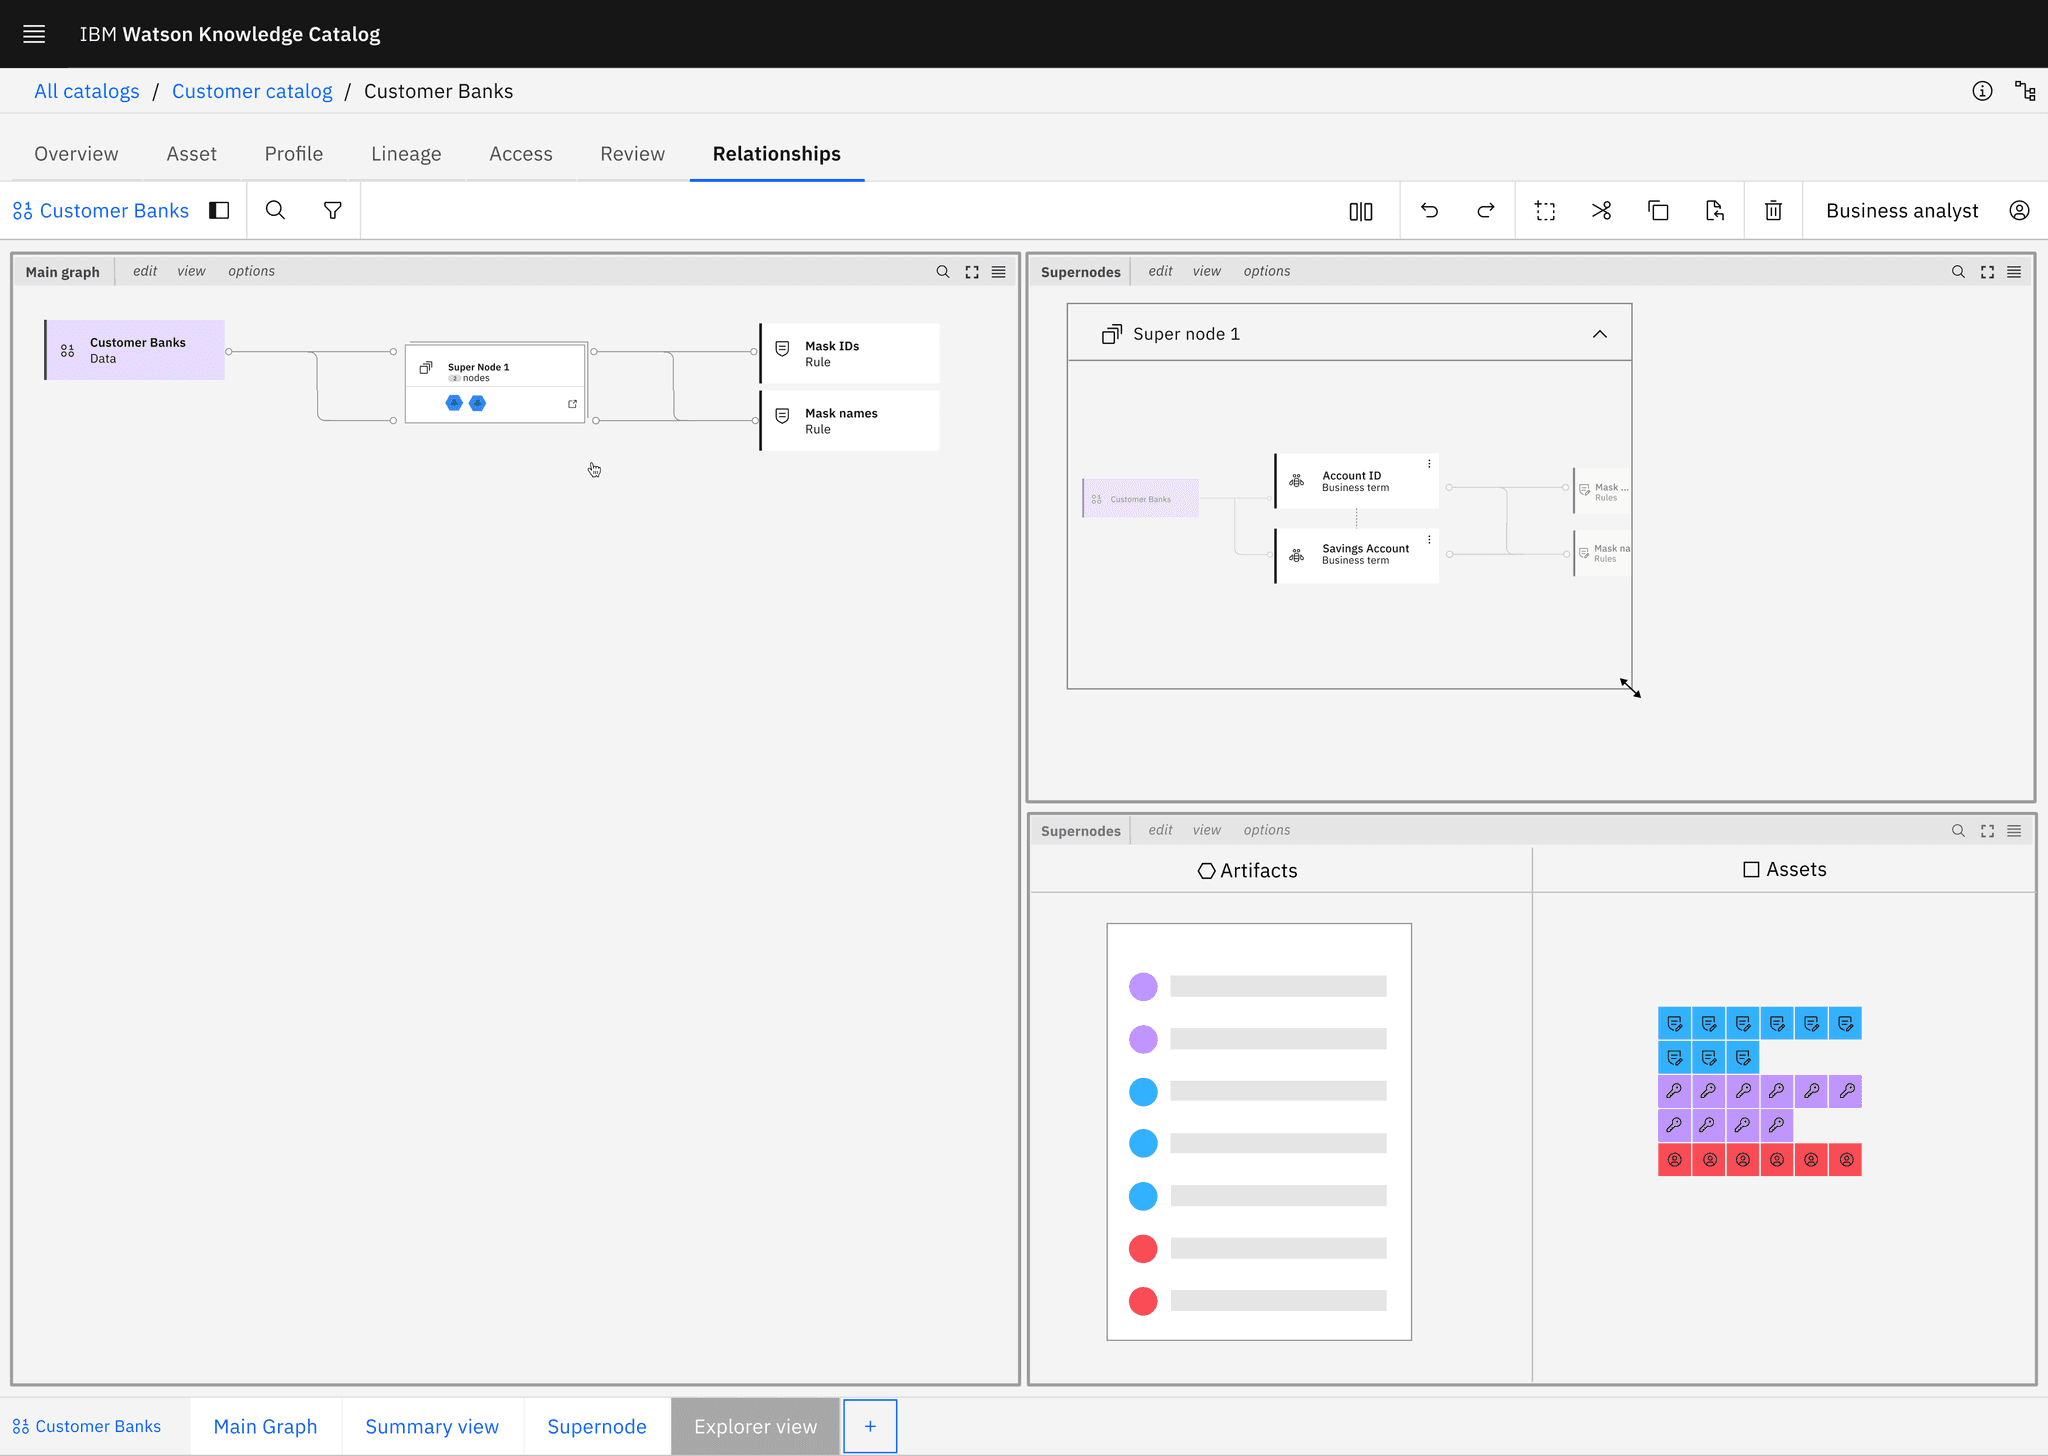
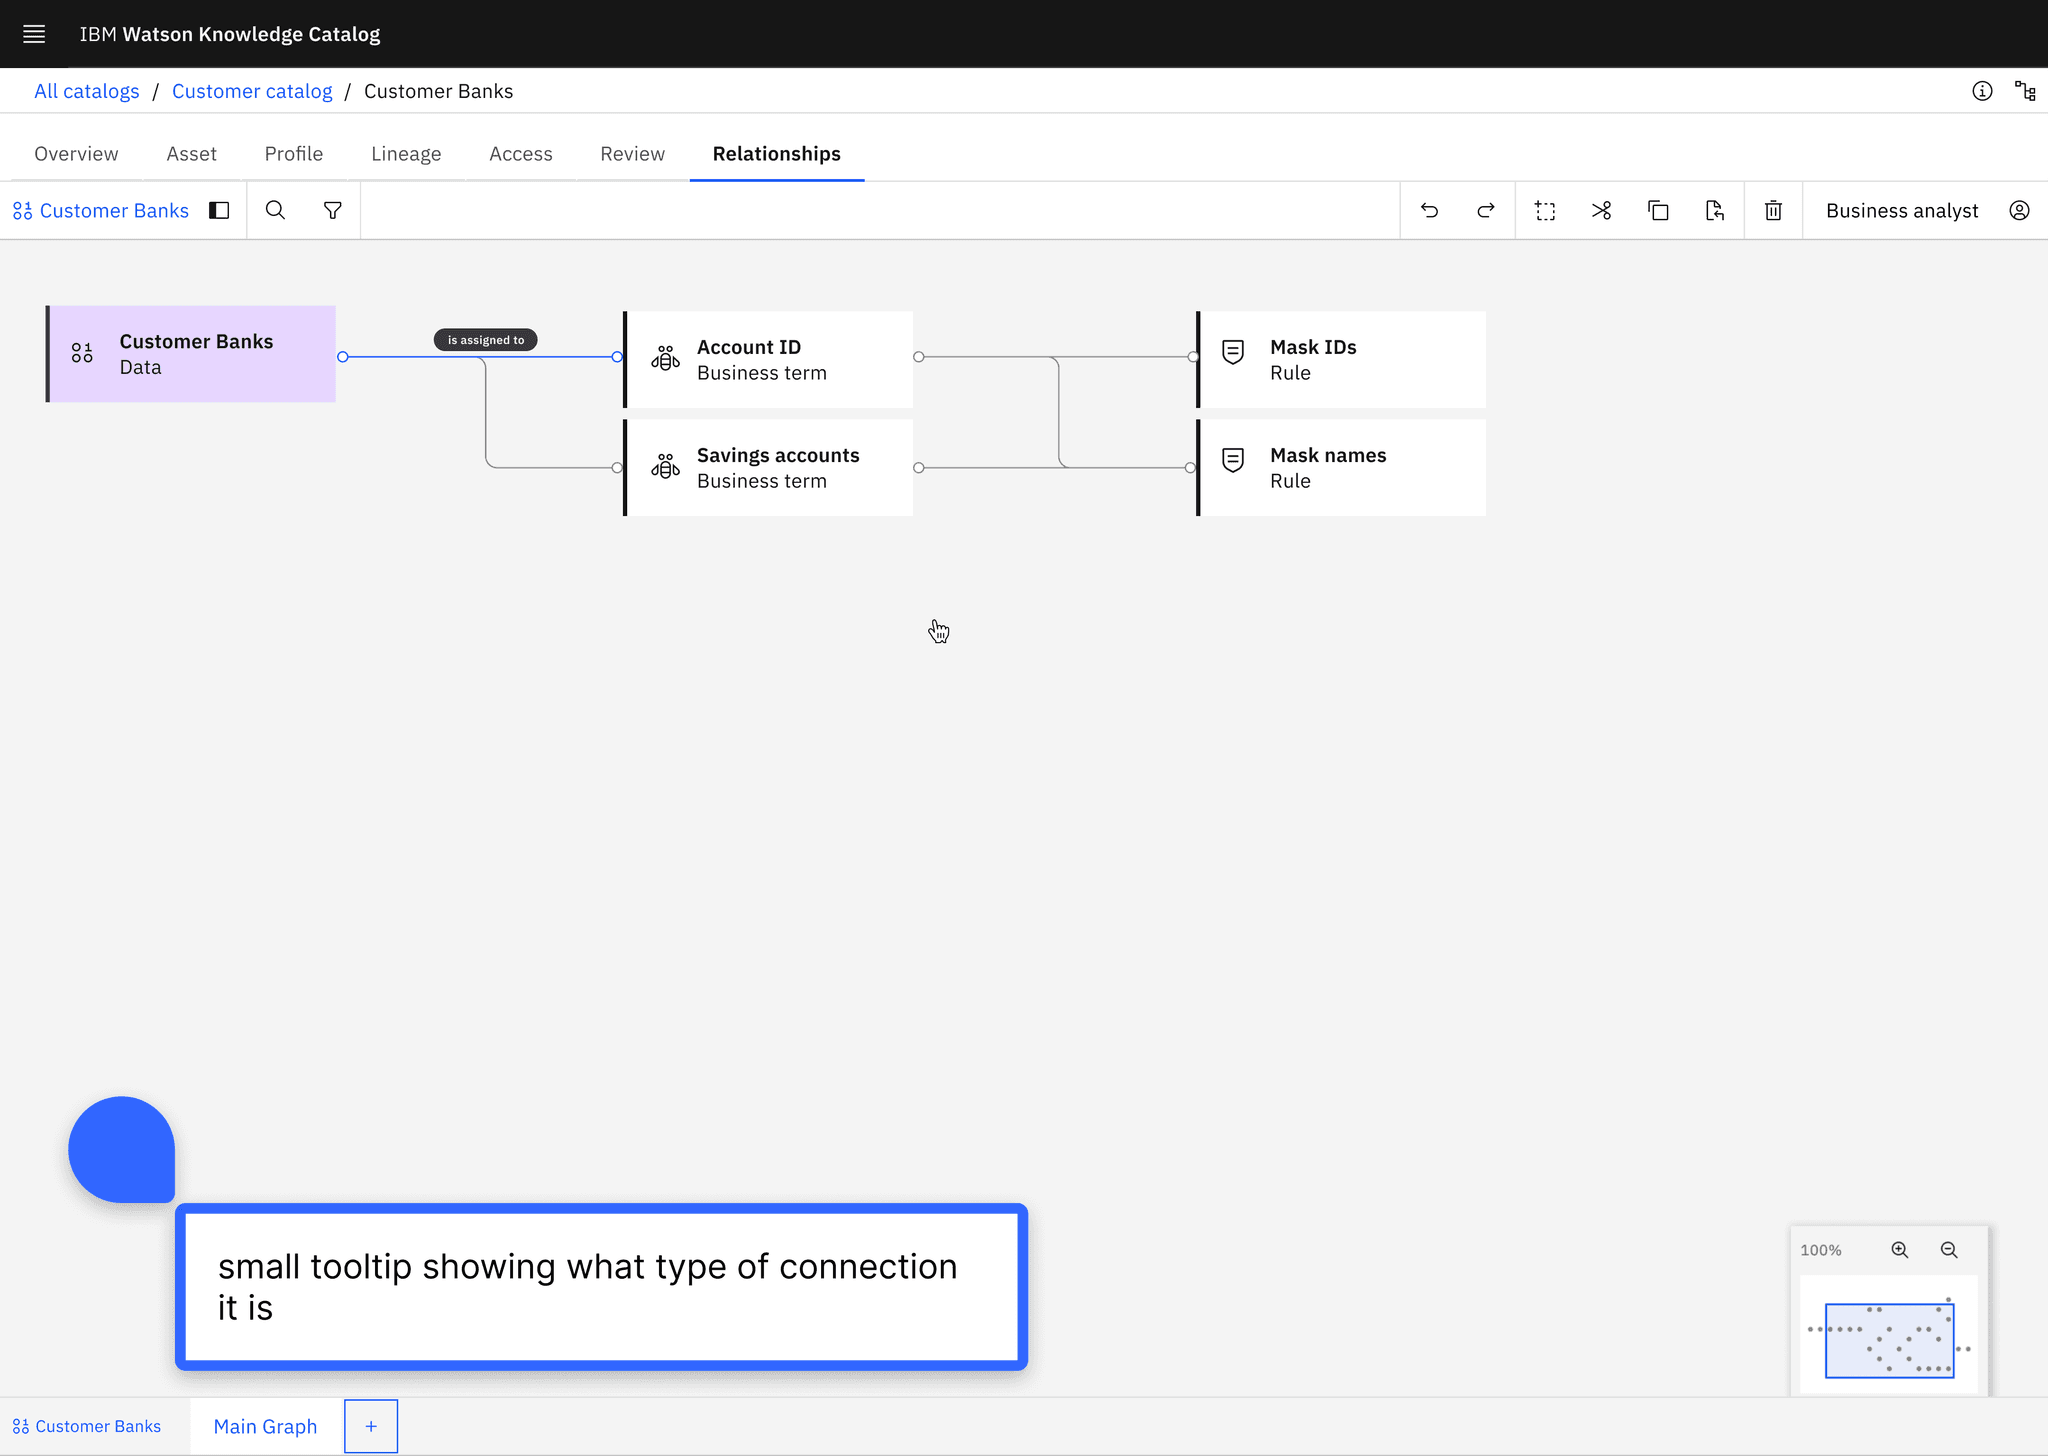
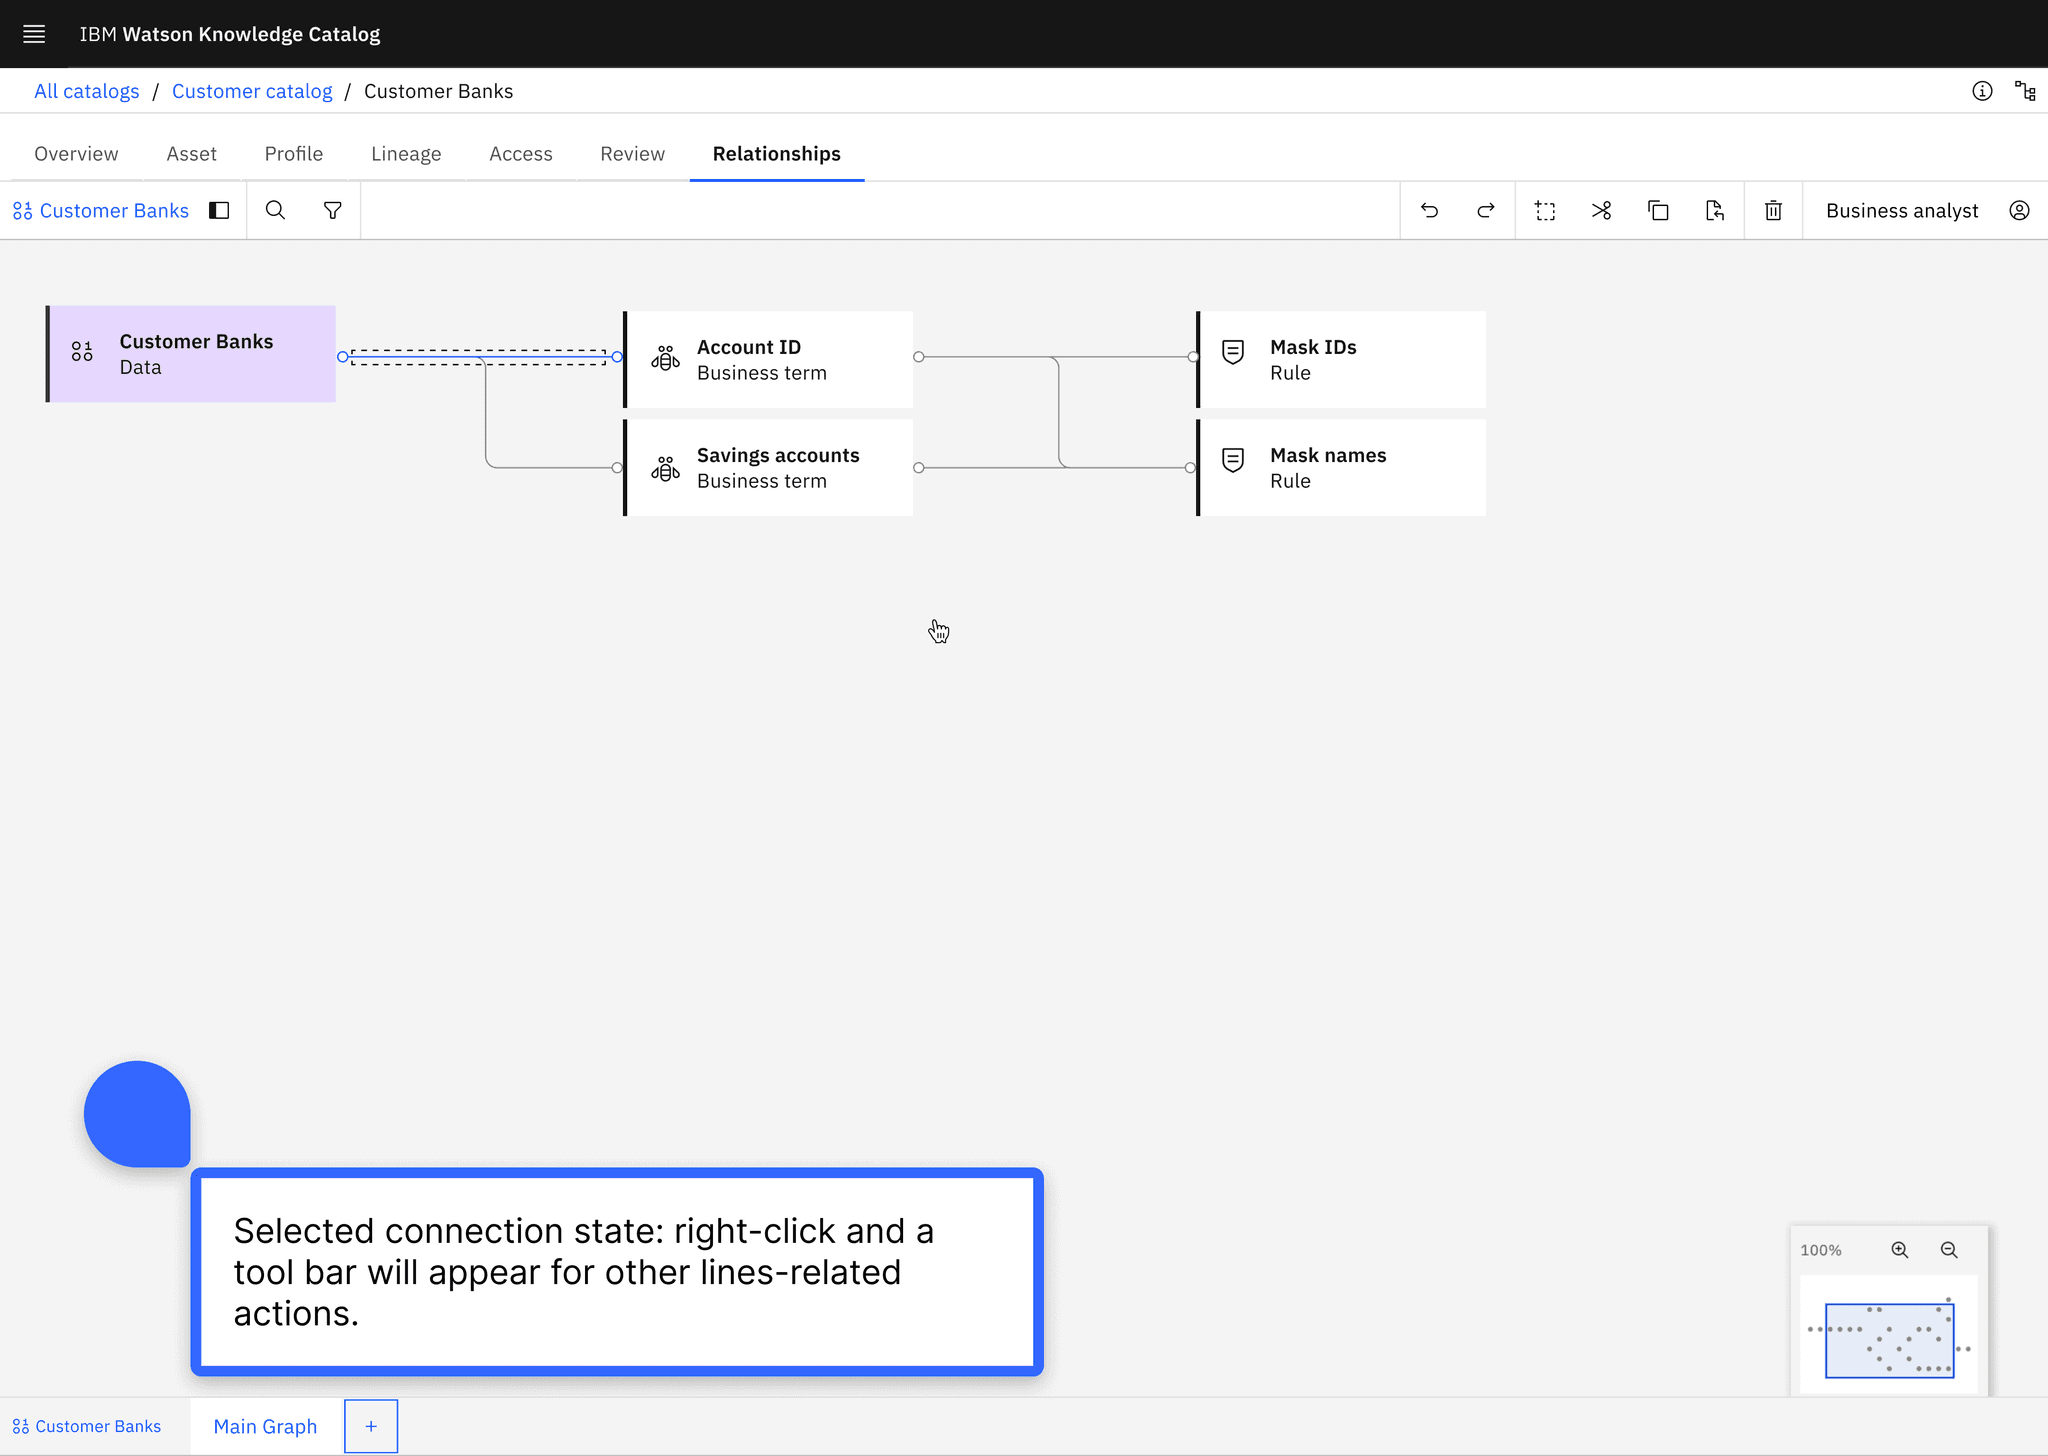
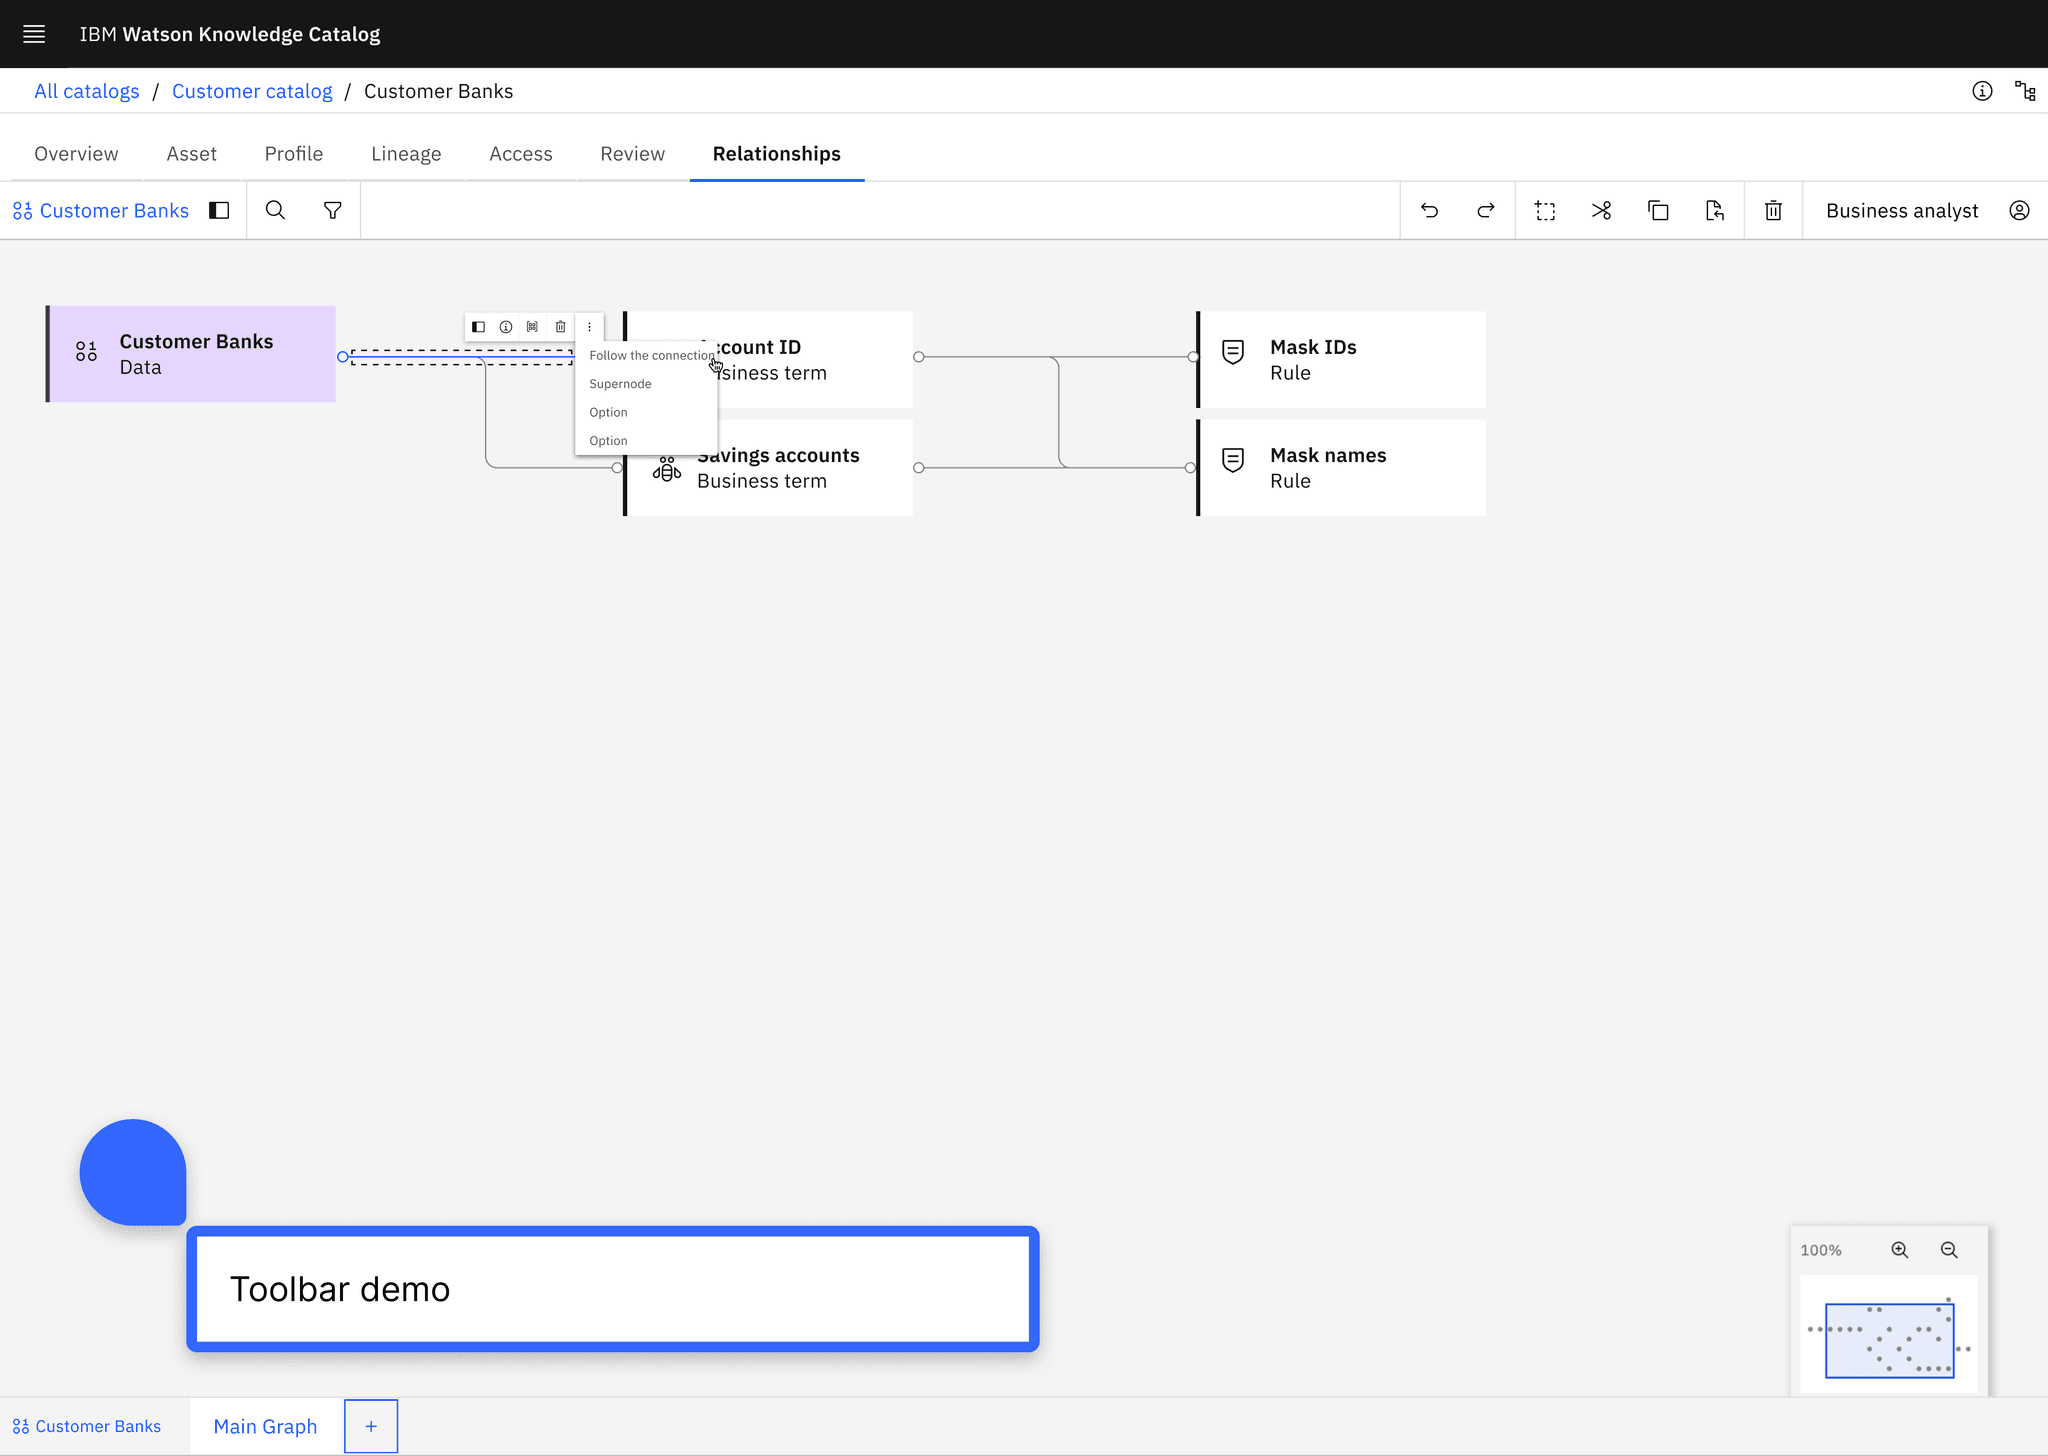
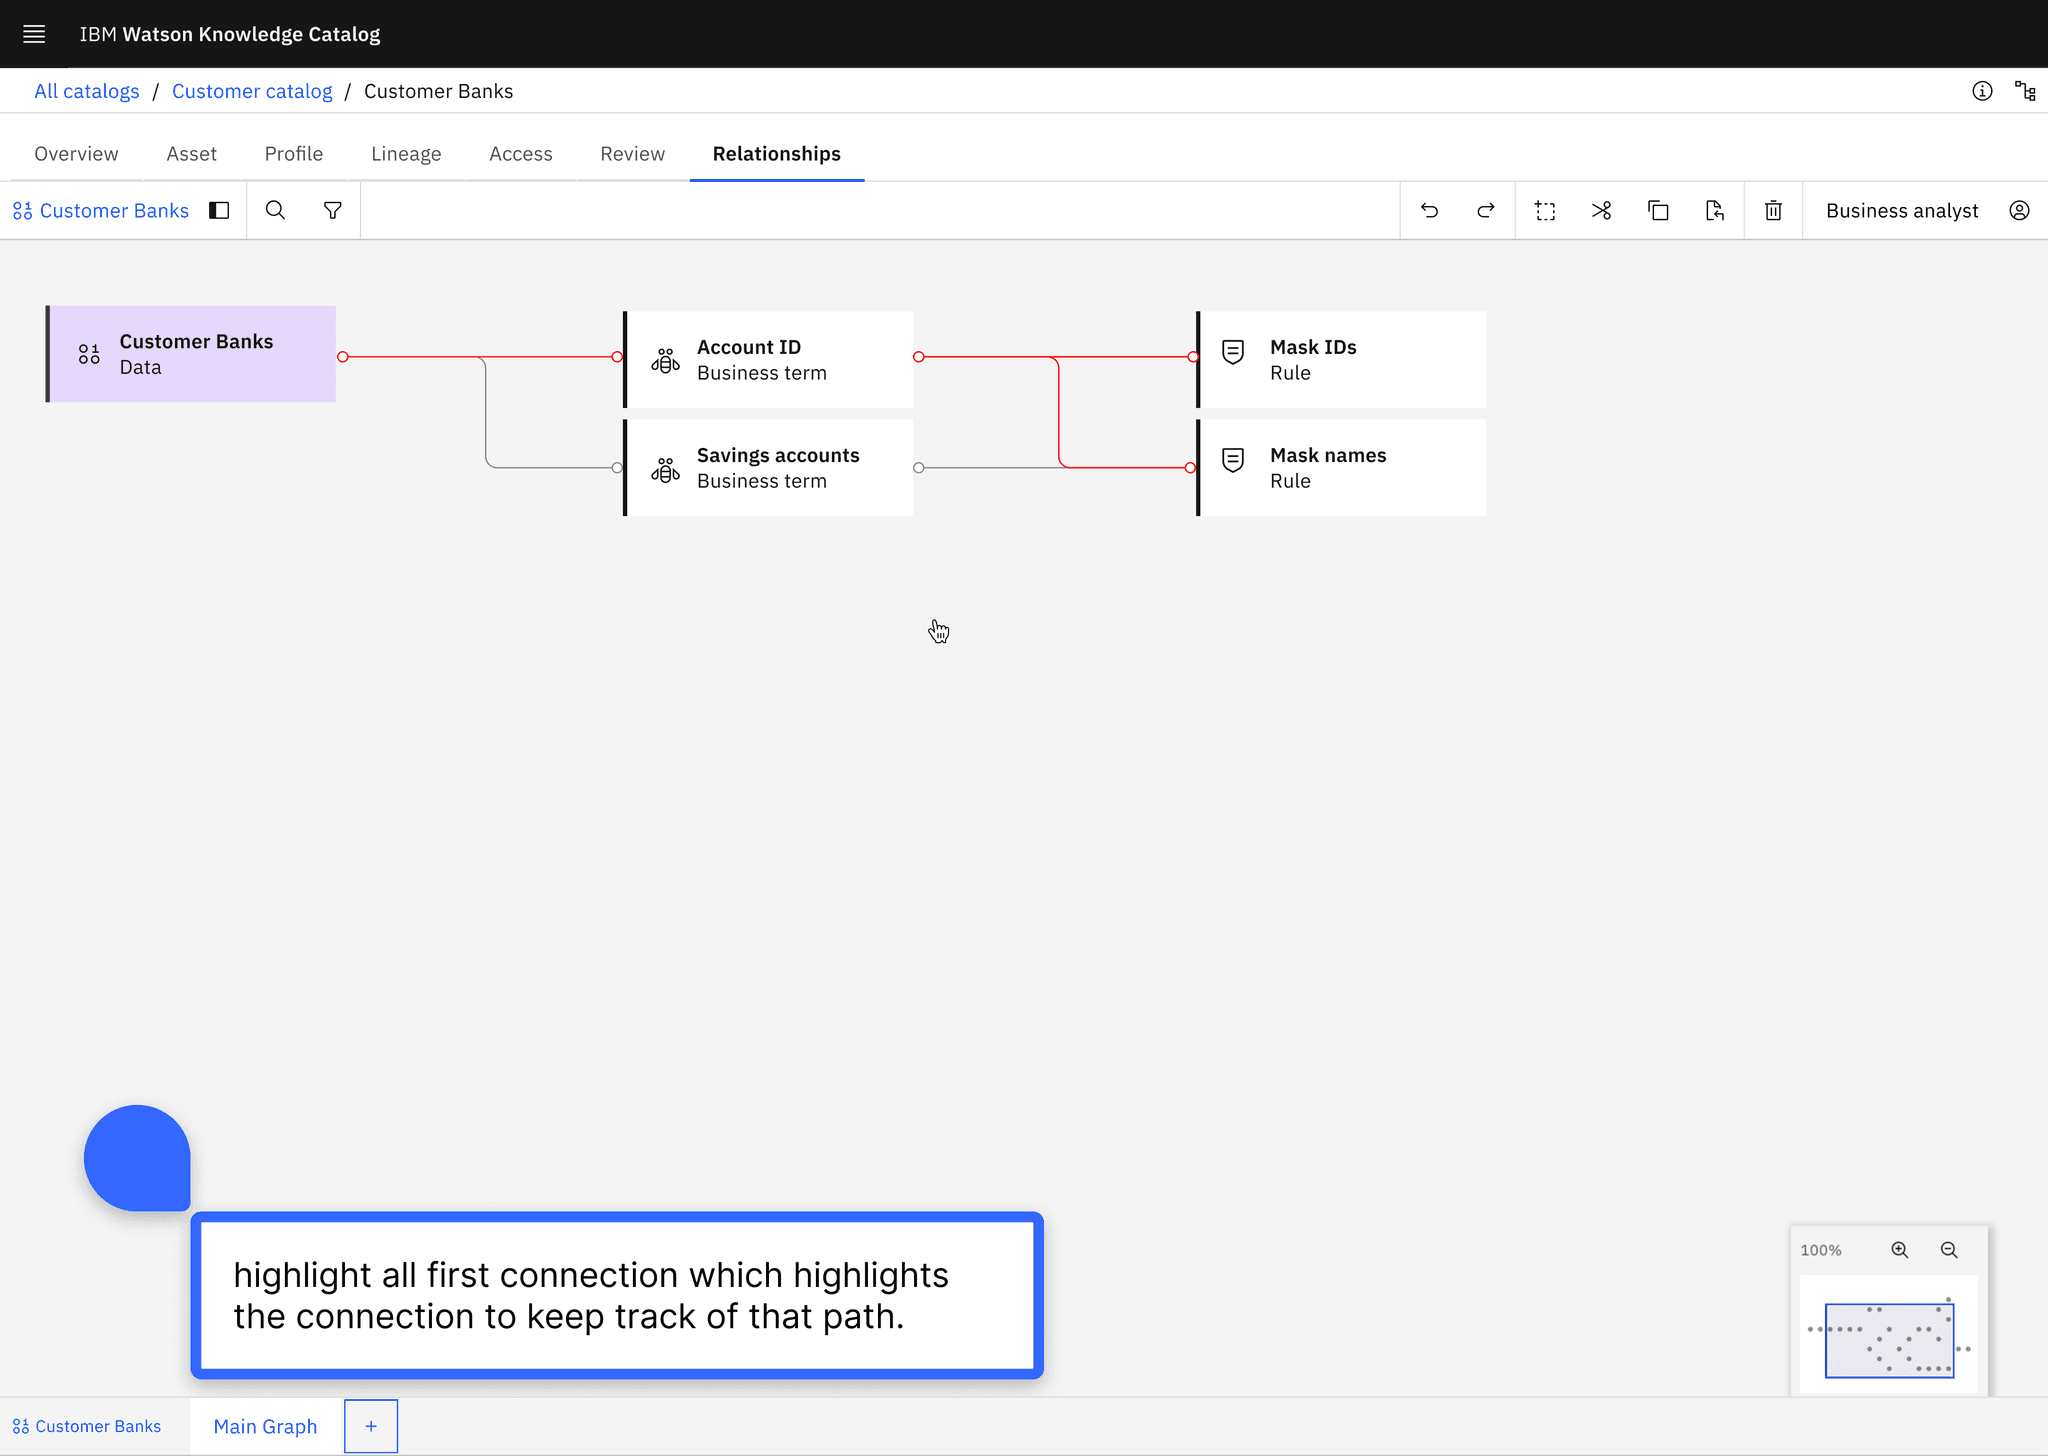
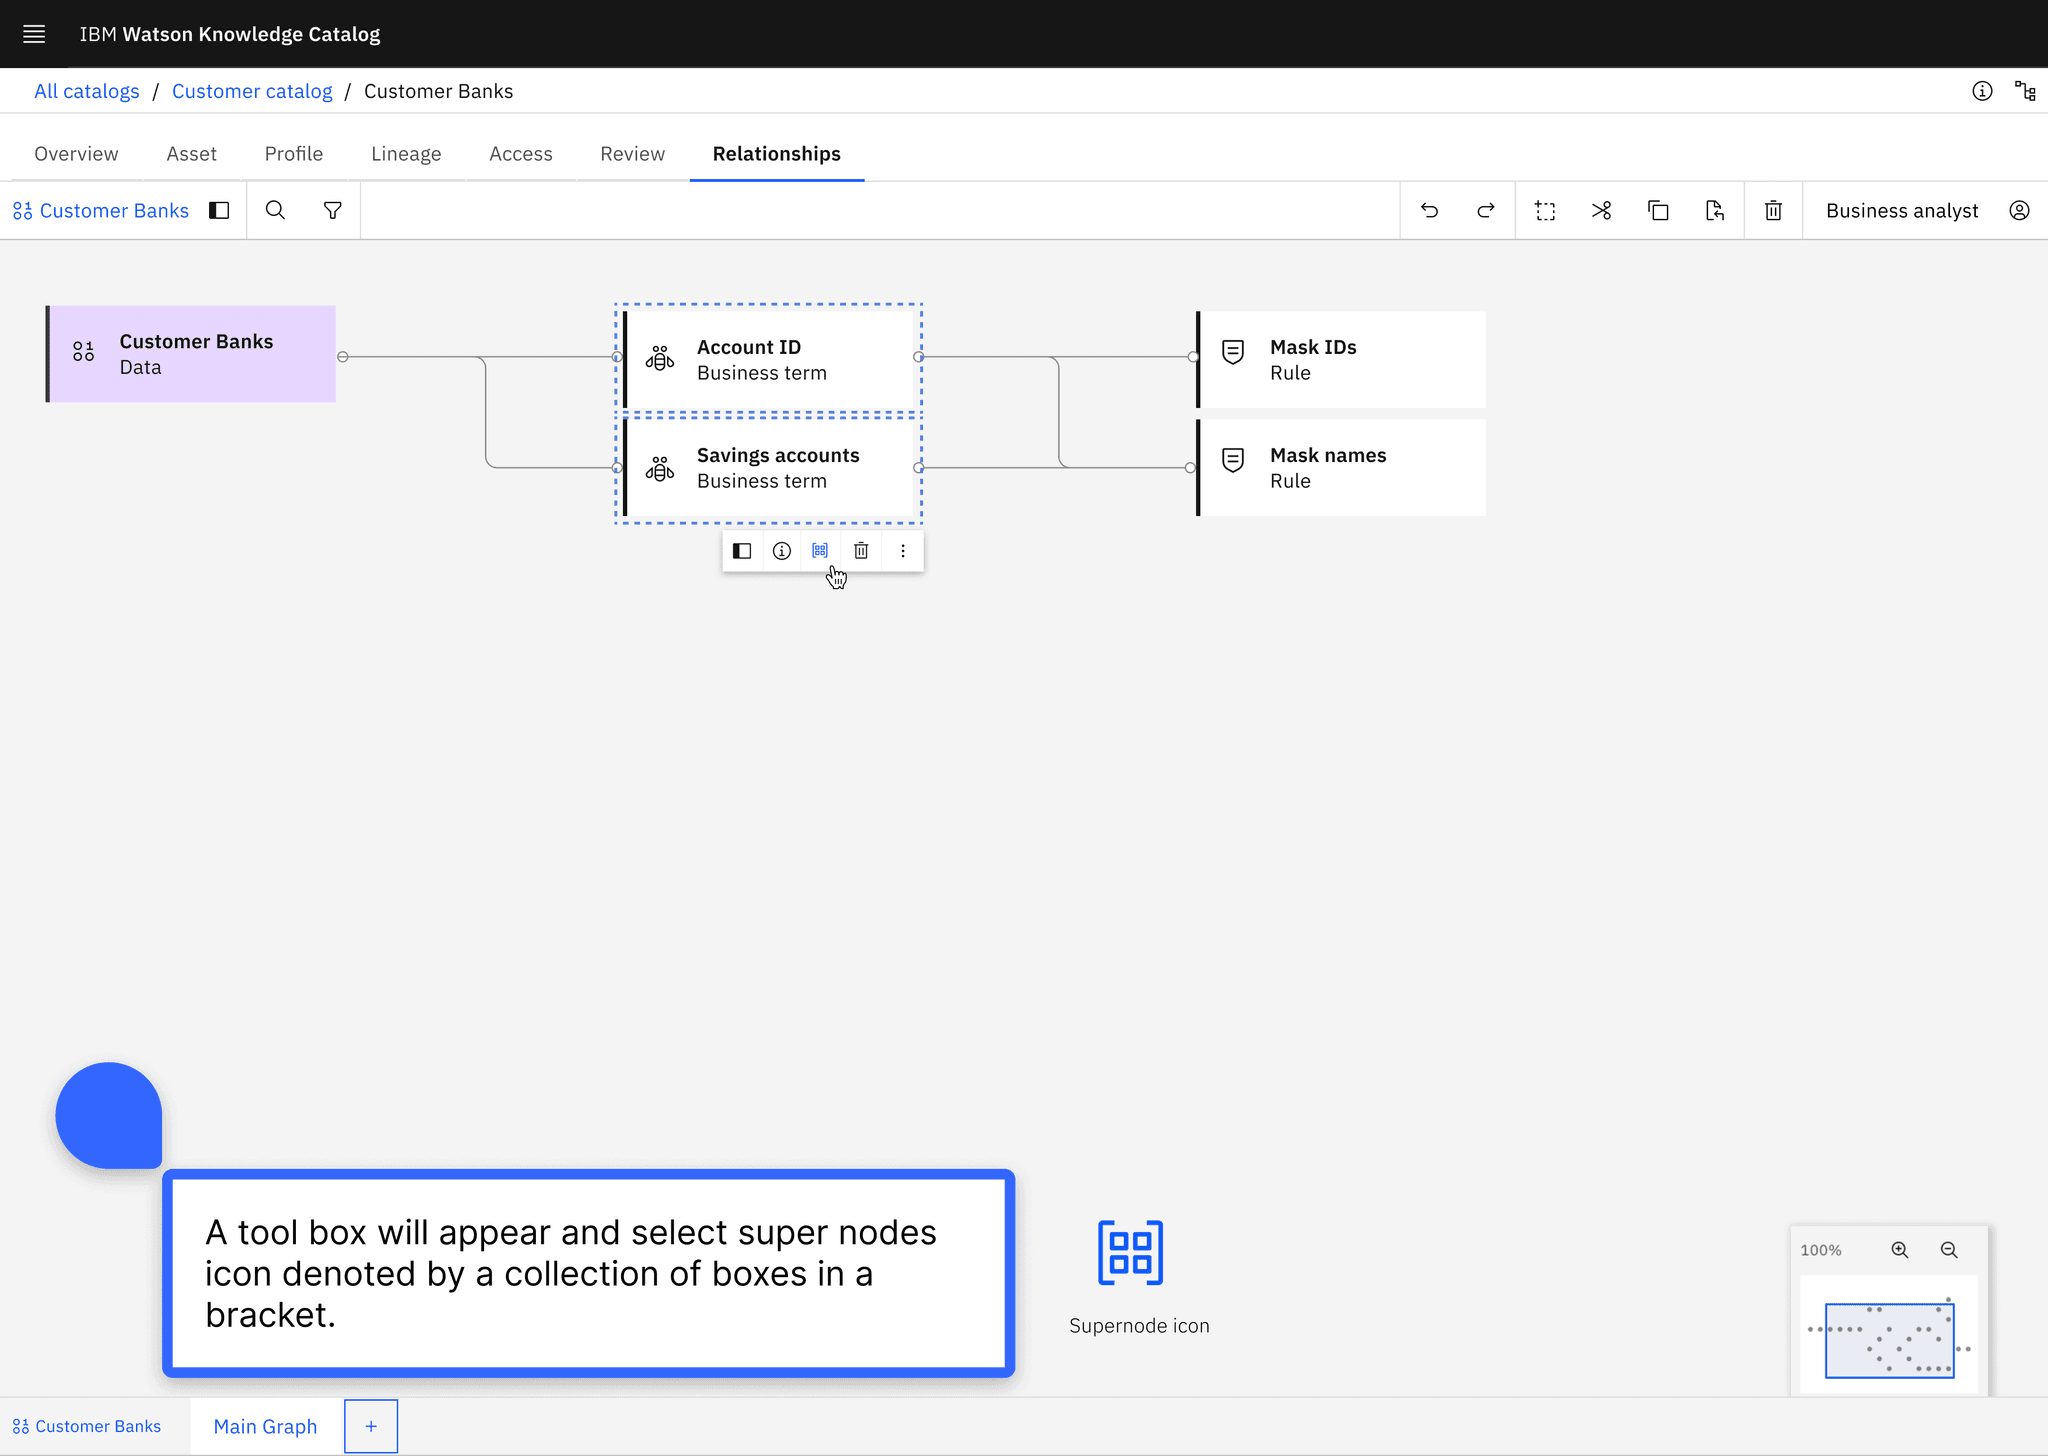
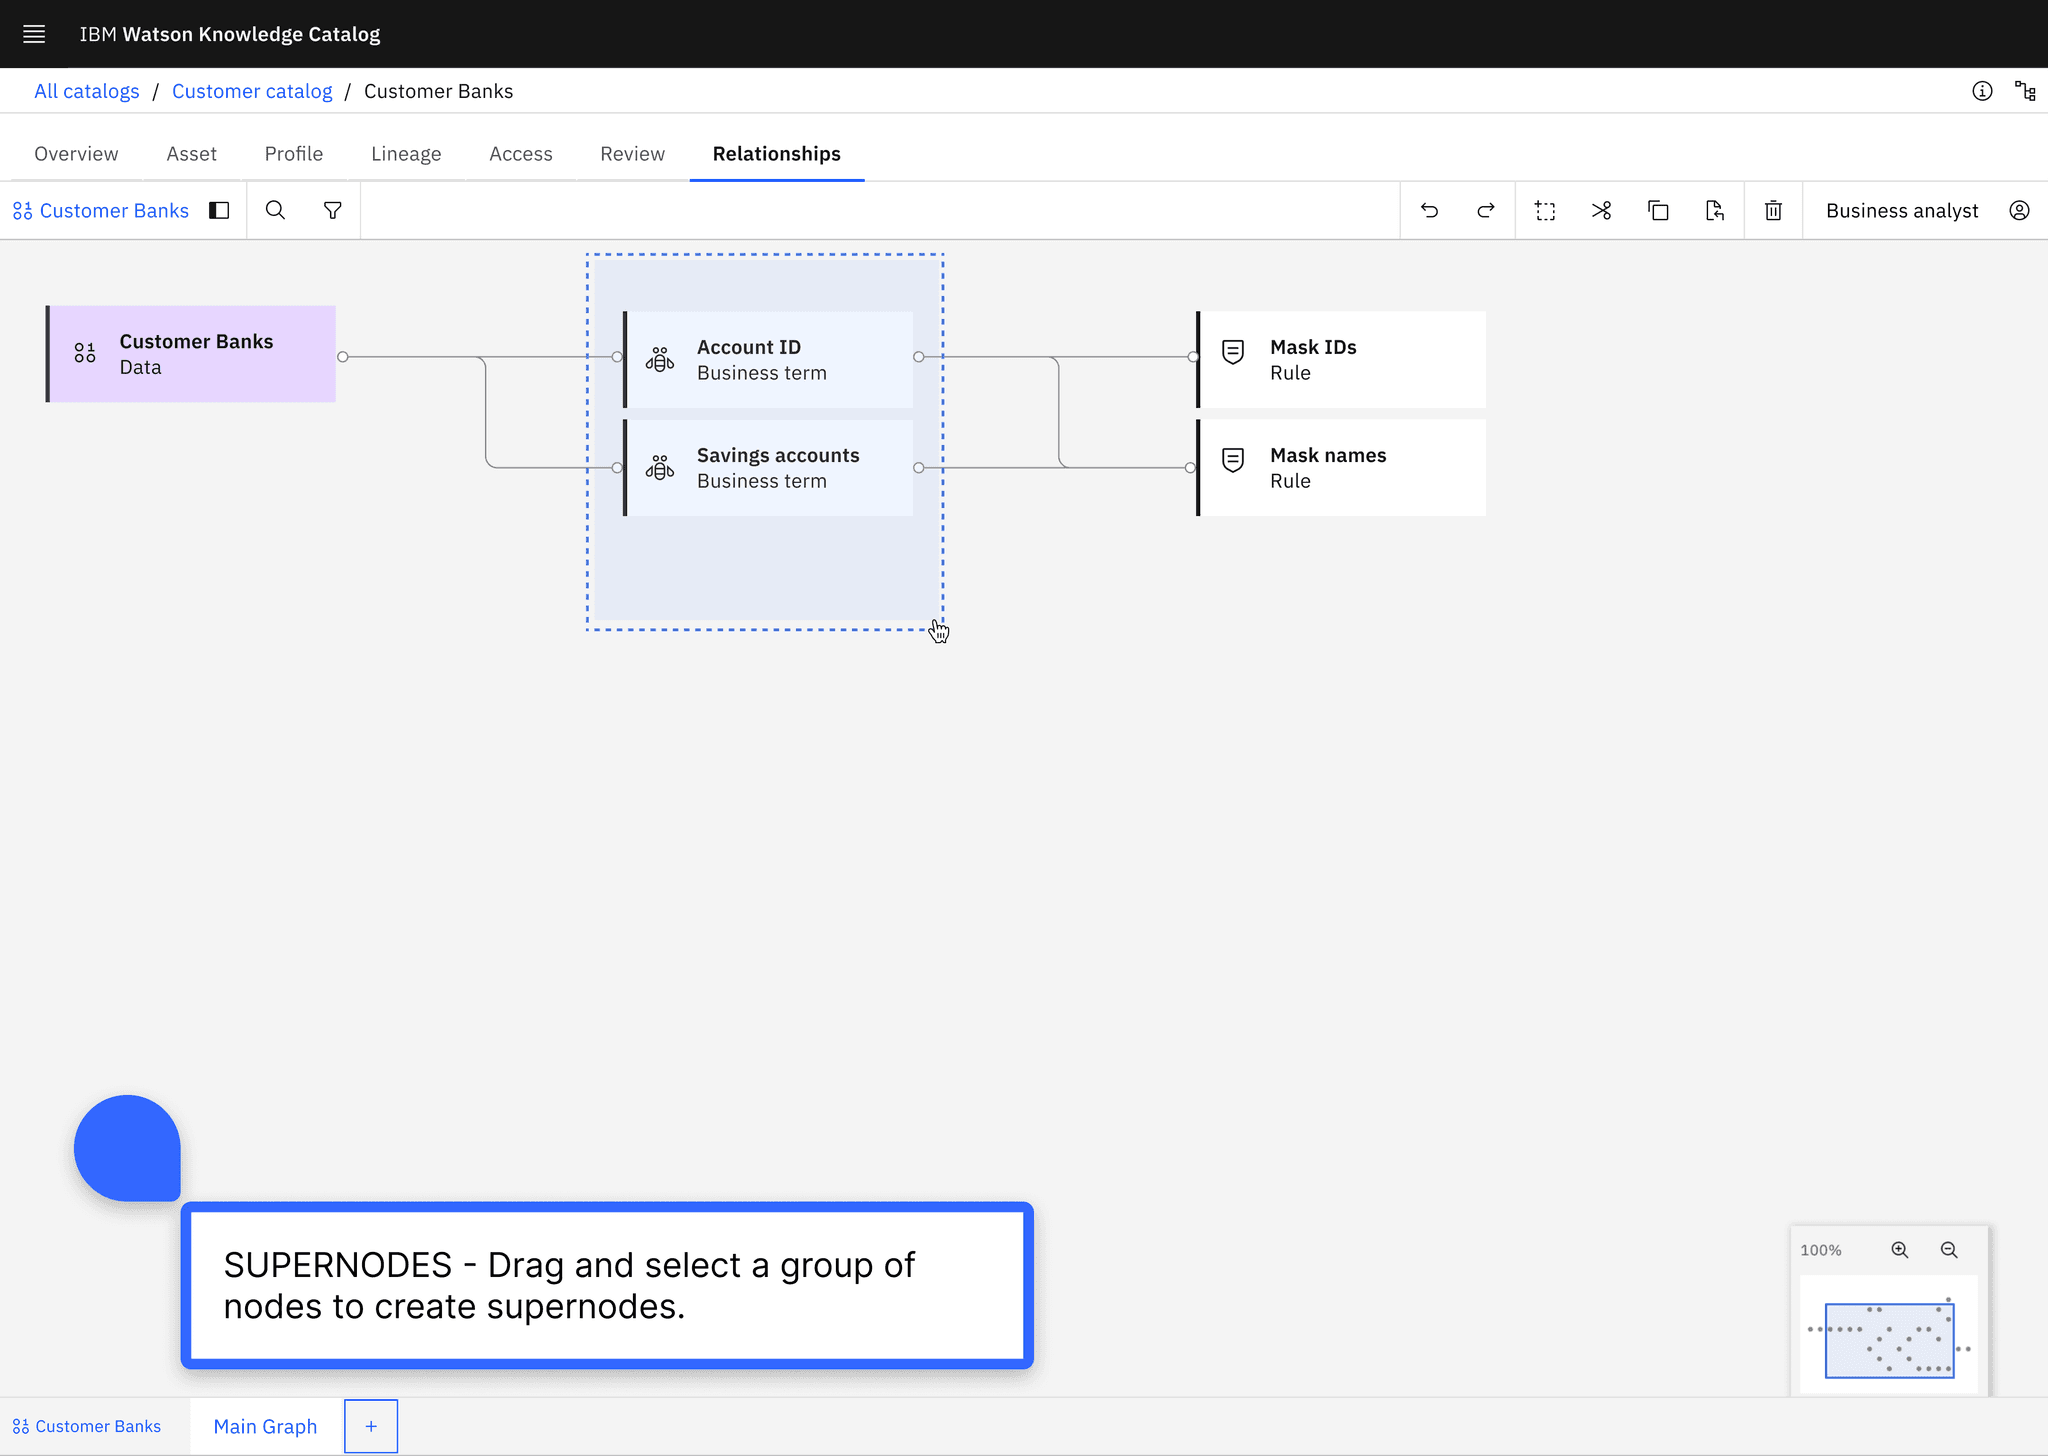
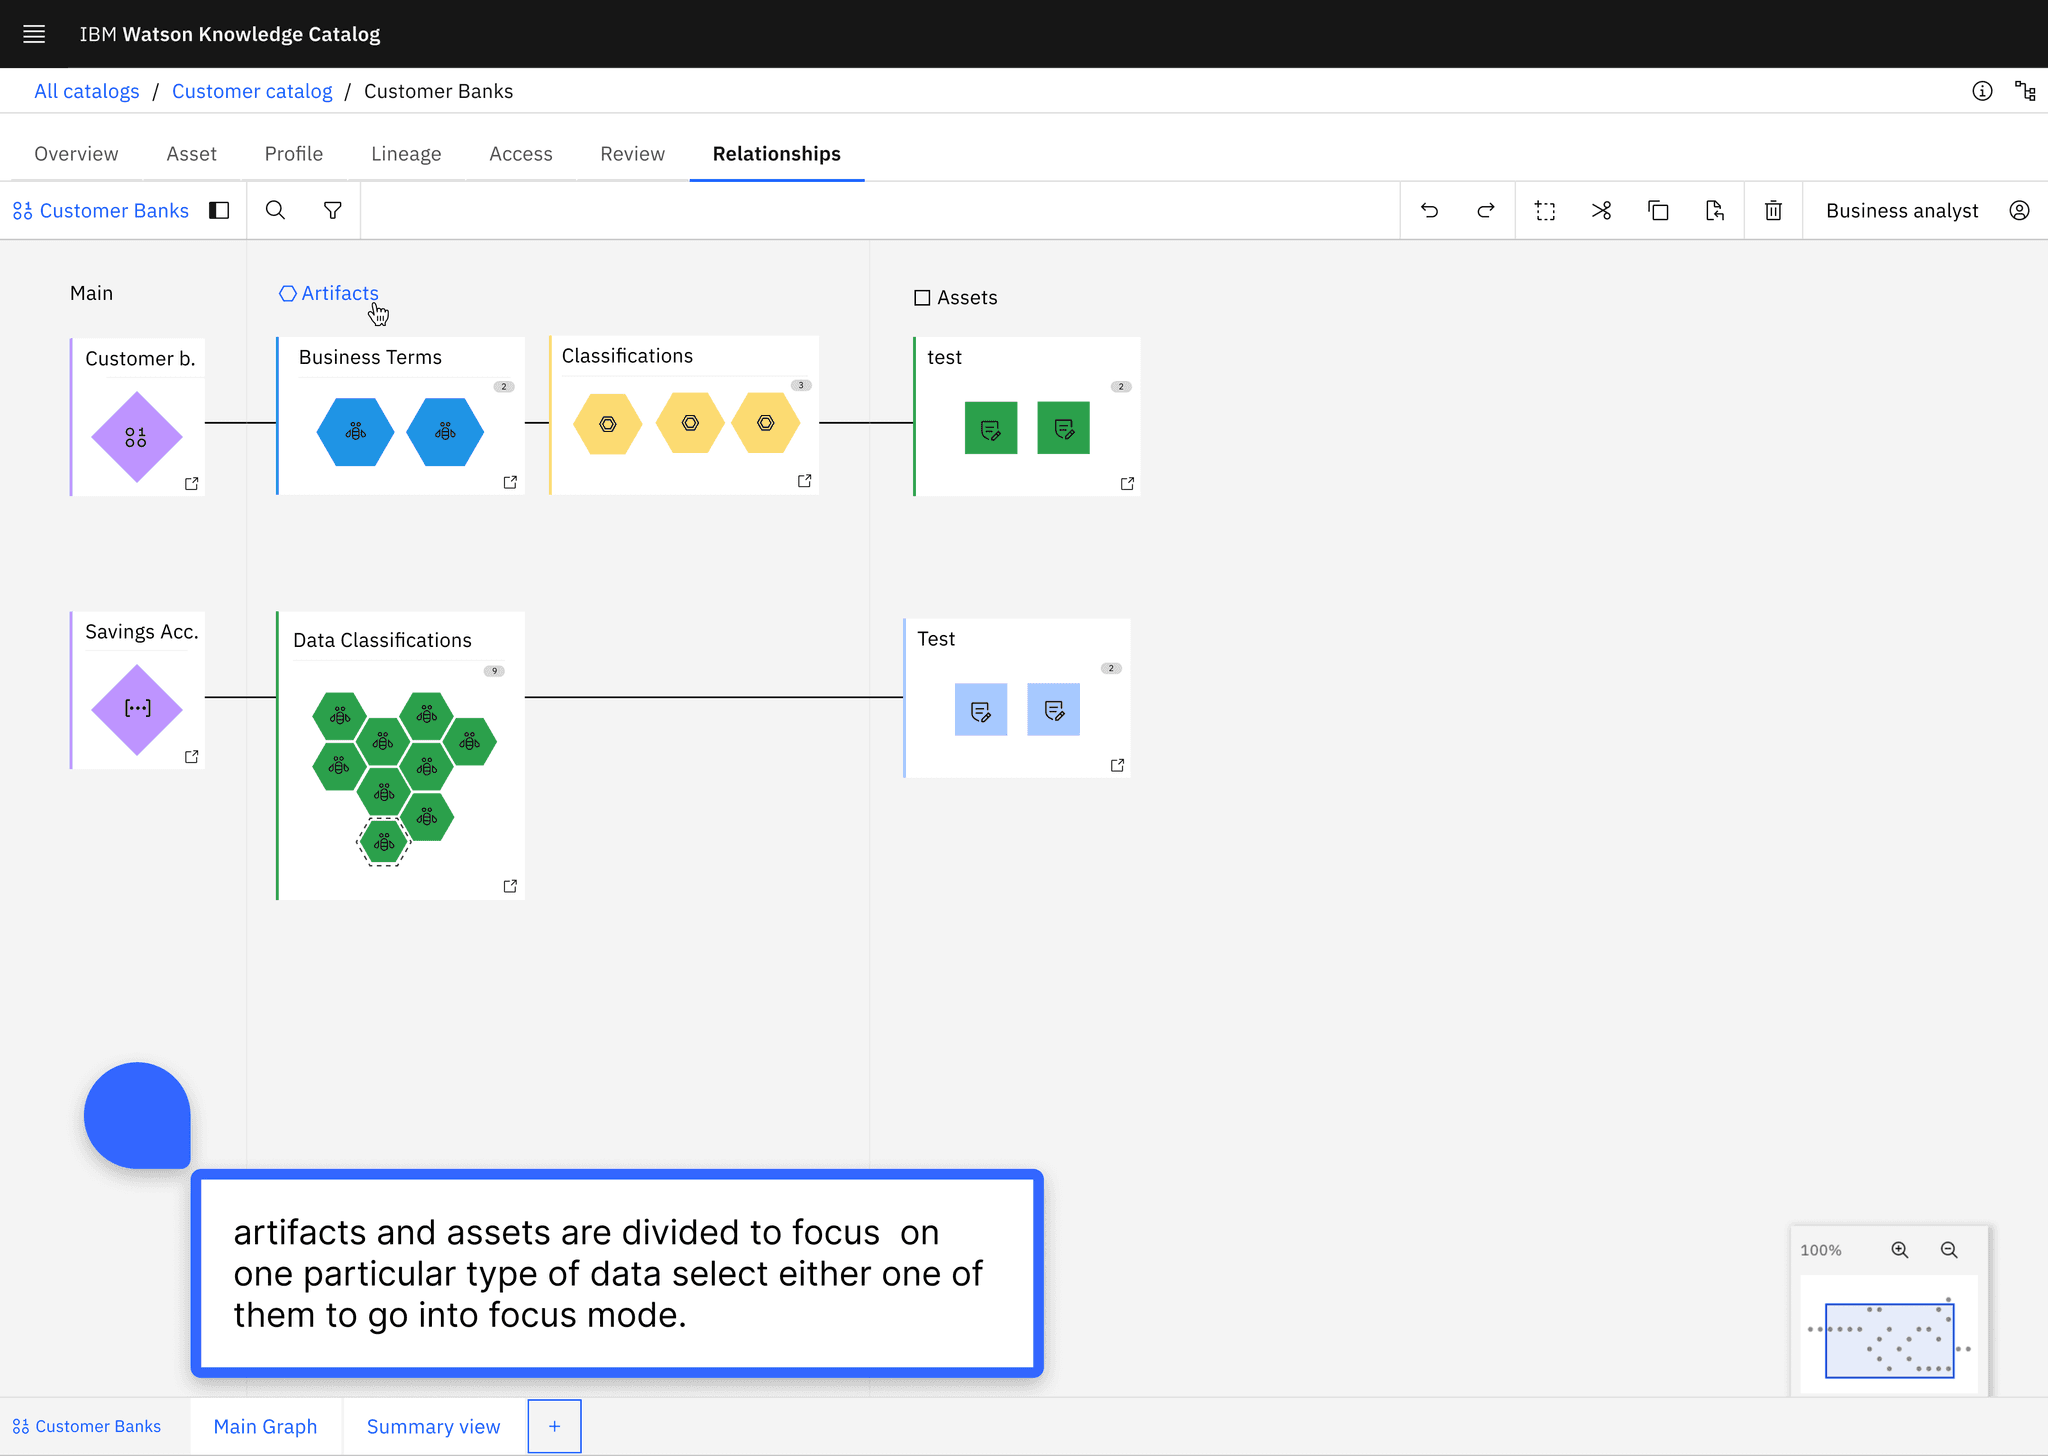
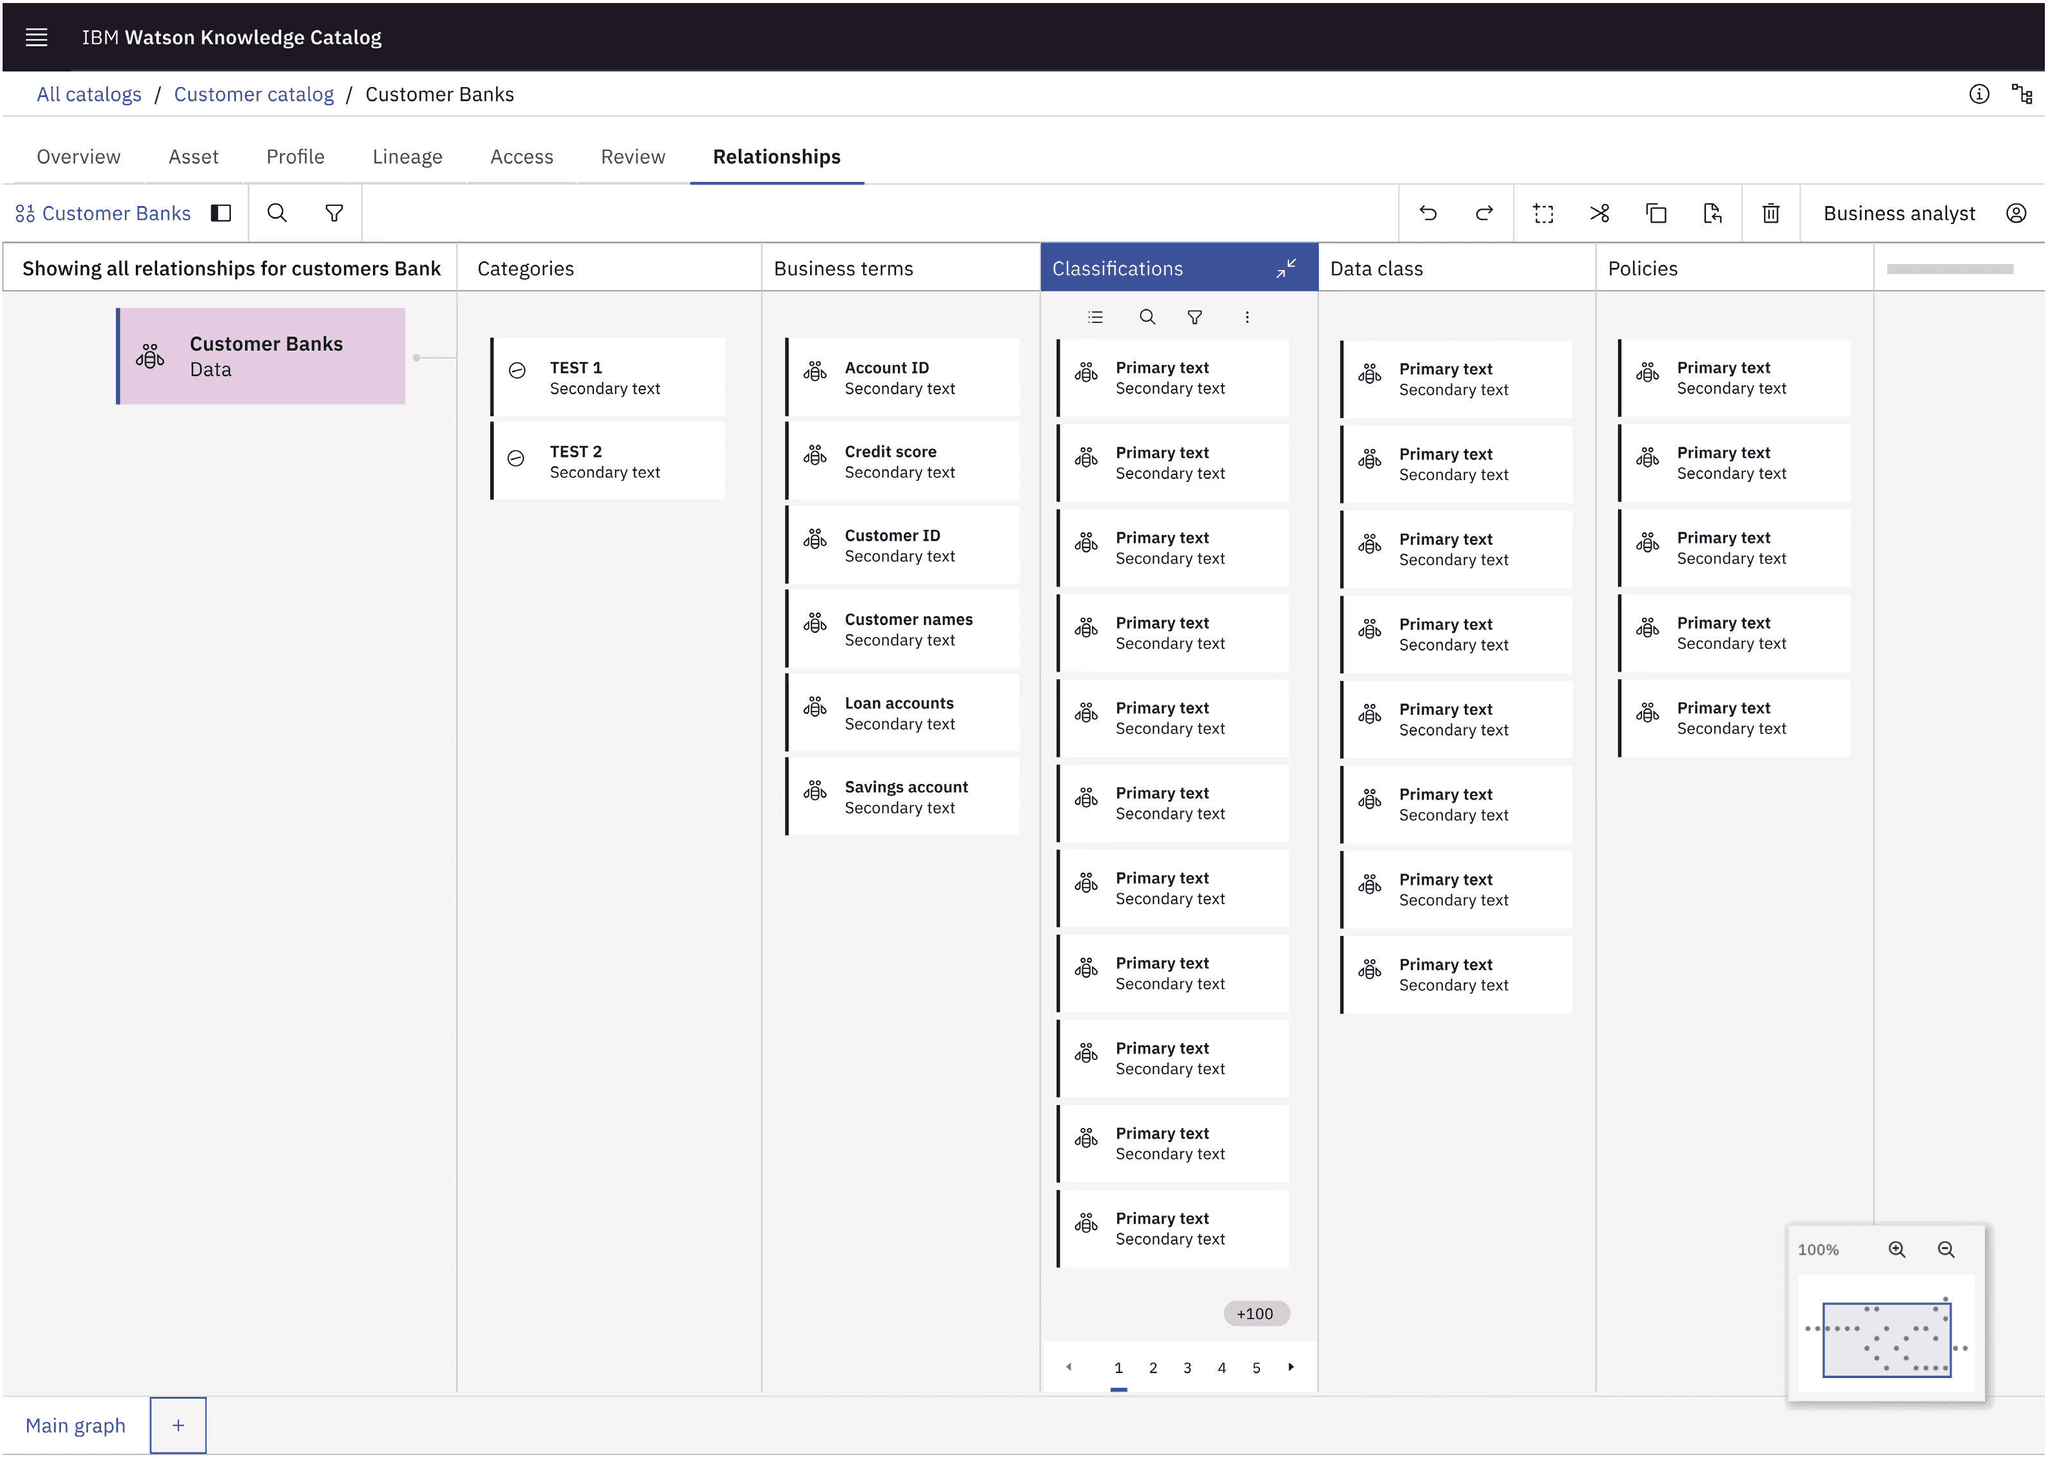
Enterprise software can be tricky to understand, so here’s what you’ll see going forward: Relationship Explorer visually maps out connections between pieces of data using a node-based view. Users can see how data rules and items link together, with a side panel to explore details or open multiple screens to view various relationships side-by-side. This design makes it easy for professionals to navigate complex data connections in a clear, flexible way.

Enterprise software can be tricky to understand, so here’s what you’ll see going forward: Relationship Explorer visually maps out connections between pieces of data using a node-based view. Users can see how data rules and items link together, with a side panel to explore details or open multiple screens to view various relationships side-by-side. This design makes it easy for professionals to navigate complex data connections in a clear, flexible way.

Enterprise software can be tricky to understand, so here’s what you’ll see going forward: Relationship Explorer visually maps out connections between pieces of data using a node-based view. Users can see how data rules and items link together, with a side panel to explore details or open multiple screens to view various relationships side-by-side. This design makes it easy for professionals to navigate complex data connections in a clear, flexible way.

Ayush joined our WKC Lineage team as an intern and has been involved in a project called Relationship Explorer.

The project is very challenging and requires a deep level of understanding that Ayush has been able to pick up in a relatively short amount of time.

From day 1, Ayush has been eagerly learning and contributing to the best of his abilities. Ayush has demonstrated the ability to process feedback, ask the right questions, and autonomously execute on complex designs. He also has shown a strong work ethic and a desire to continue growing on our team.

Michael Mahmood

Design Strategist/Manager at IBM

Ayush is an innovative, dedicated, and enthusiastic designer whom our design team has grown to rely on. From the beginning, Ayush was eager to gain domain knowledge about data lineage, an existing project, and relationship explorer, a new project that he has become a great contributor of. Once he felt more comfortable with the basics, he stepped in to help transform user research notes into organized observations and findings; these were crucial to guiding the next steps for our product management, development, and design stakeholders. Ayush is not hesitant to ask questions to learn more and ensure he's prepared, but he is also unafraid to start exploring design ideas on his own and voice suggestions or new ideas. This was particularly helpful when our second designer began transitioning roles and Ayush stepped in to iterate new features for the relationship explorer prototype, which would be used for future research. I have collaborated with Ayush on different aspects of the prototype so that we can improve and consolidate our ideas, and I appreciate his abilities to think outside of the box, organize his work, and communicate with polite directness. Ayush has demonstrated that he  is a passionate, effective, and adaptable person to work with who will surely bring value to any team he joins

Jamie Har

UX Designer at IBM

Description

Description

Description

Description

Description

Description

Description

The entrance point into the explorer is displayed on the screen below. We may choose which data items we want to examine and open them into the graph.

The entrance point into the explorer is displayed on the screen below. We may choose which data items we want to examine and open them into the graph.